GGR270H1 Final: Week 3 Study Notes

Document Summary
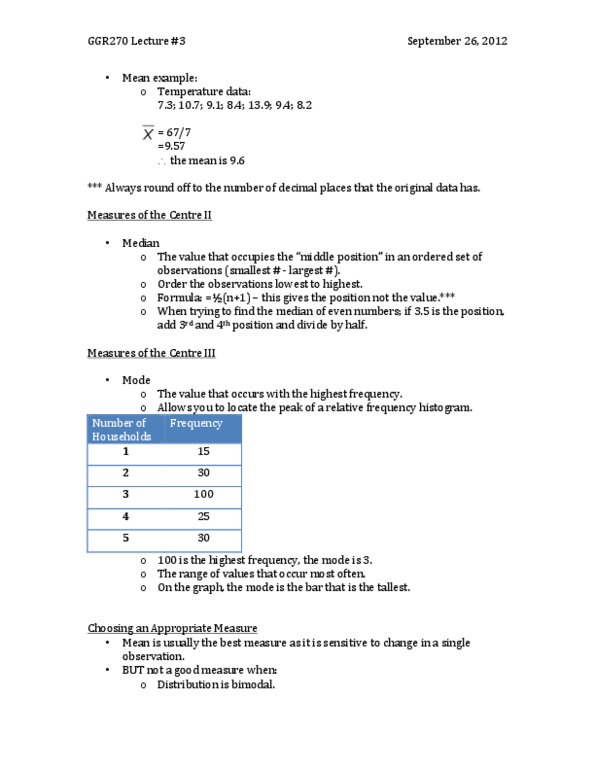
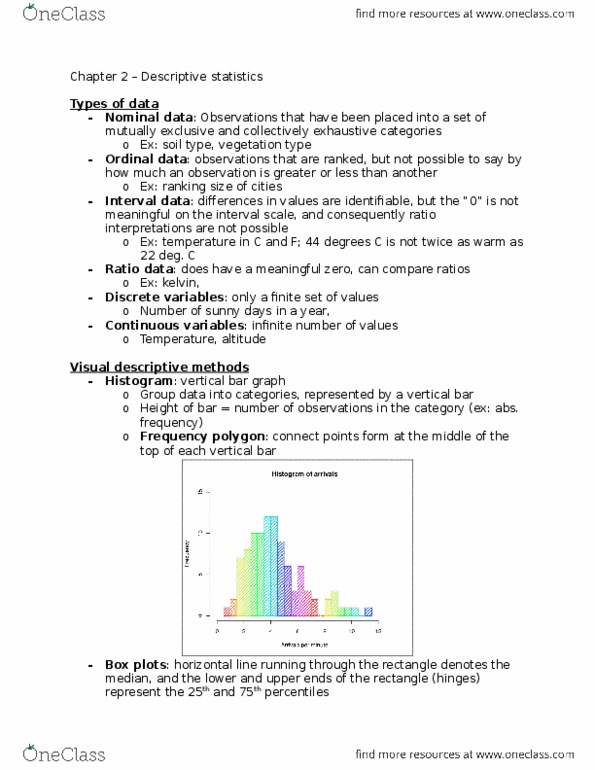
Ggr 270 lecture 3 september 29, 2010. graphs are limited in what they can tell us. difficulty making inferences about a population when looking at a subset or sample. measures associated with the population are called parameters. measures associated with a sample are called statistics. most commonly used measure of central tendency. sum of all values or observations divided by the number of observations. value occupying the middle position" in an ordered set of observations. order the observations, lowest to highest, and find the middle position www. notesolution. com. value that occurs with the highest frequency. allows you to locate the peak of relative frequency histogram. Mean is usually the best measure as it is sensitive to change in a single observation. outliers (extreme values) are present in the data set. Positive skew mode, med, mean mean>median. Negative skew mean, median, mode mean