Economics 2124A/B Study Guide - Final Guide: Multidimensional Poverty Index, Gini Coefficient, Lorenz Curve

11 Dec 2017
School
Department
Course
Professor

Document Summary
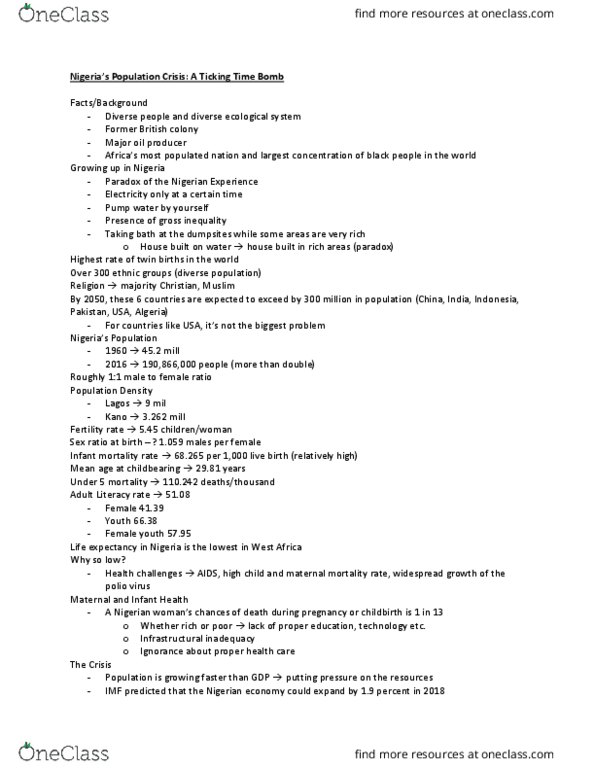
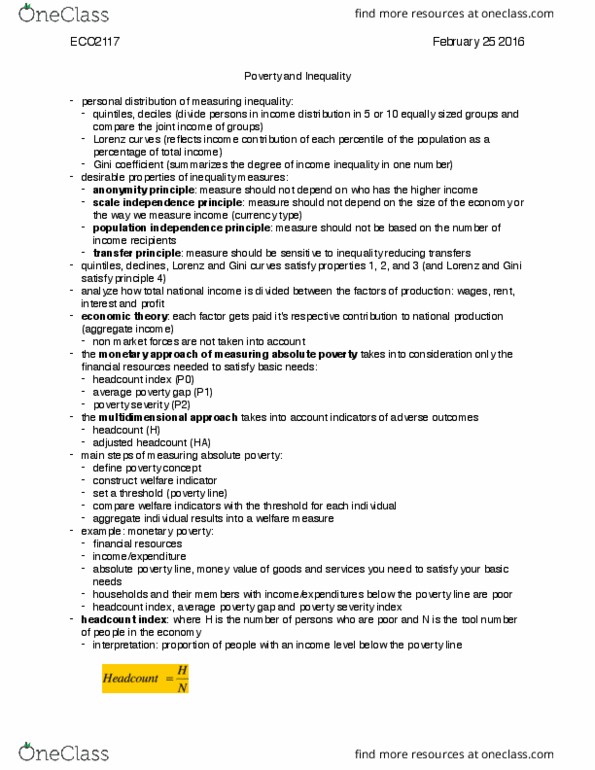
Poverty, inequality, and development: approximately 18% of the world population lives under . 25/day (almost of ratio in, slightly more than 1/3 lives on less than per day, measuring inequality and poverty, measuring inequality. Size distributions (quintiles, deciles): shows amount of income received by various classes of families or individuals (we usually use household income) If everyone had the same income, the lorenz curve would be a 45 degree line. =1 poor person: where yp is the absolute poverty line; and yi the income of the ith, 1. Income inequality leads to economic inefficiency: 2. Relative poverty leads to low credit ratings: saving lower, less investment: 3. The rich tend to invest abroad: 4. Inequality gets worse before it gets better: not necessarily, other causes of inequality: history and politics, patterns of land ownership over time. Incidence of extreme poverty is uneven: relationship between growth and poverty.