Statistical Sciences 1024A/B Study Guide - Final Guide: Interquartile Range, Pie Chart, Exploratory Data Analysis

16 Mar 2013
School
Department
Professor


Document Summary
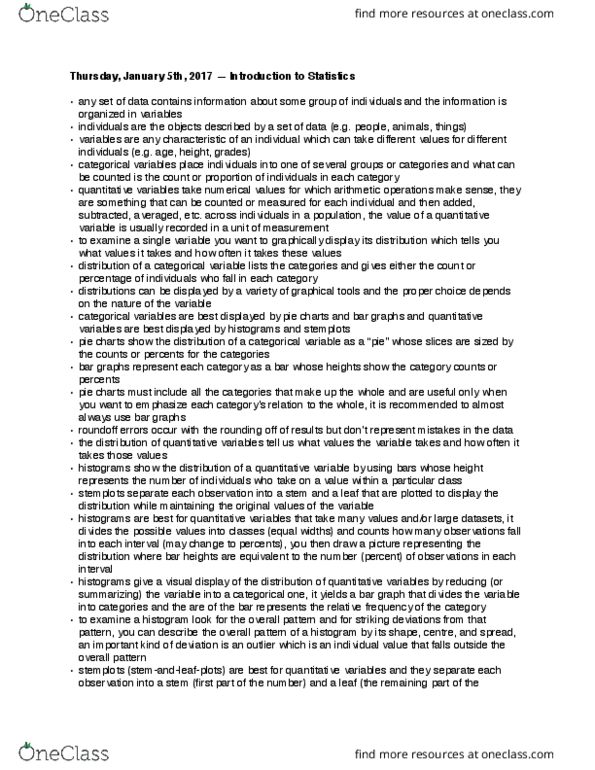
Datasets: collection of data, usually presented in table form, columns are variables (characteristic of a person/thing) rows are individuals or cases (people, things) Data can be rounded or truncated rounded 6. 3976 -> 6. 4 truncated 6. 3976 -> 6. 3 categorical variables: category or tag, qualitative. Pie charts, bar graphs usually described by words or letters. Quantitative variables: numerical value, always have a unit of measurement. Exploratory data analysis: examining data for their main features slenderman example. Distribution of a variable tells us what values the study takes and how often it takes them: categorical displays. Usually show number count and percentage count. 2) pie chart shows fraction of cases in each category. Each bar corresponds to a category of data. Maximum value should be near the top of the chart common problems with bar graphs. Width of bars should be equal (ex. bad graph with the houses as bars: quantitative variable displays.