[PS101] - Final Exam Guide - Comprehensive Notes for the exam (86 pages long!)

Document Summary
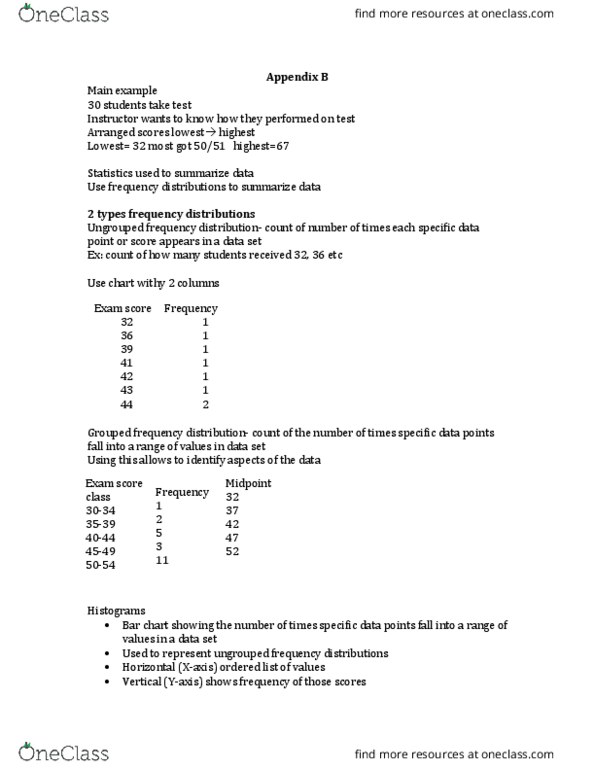
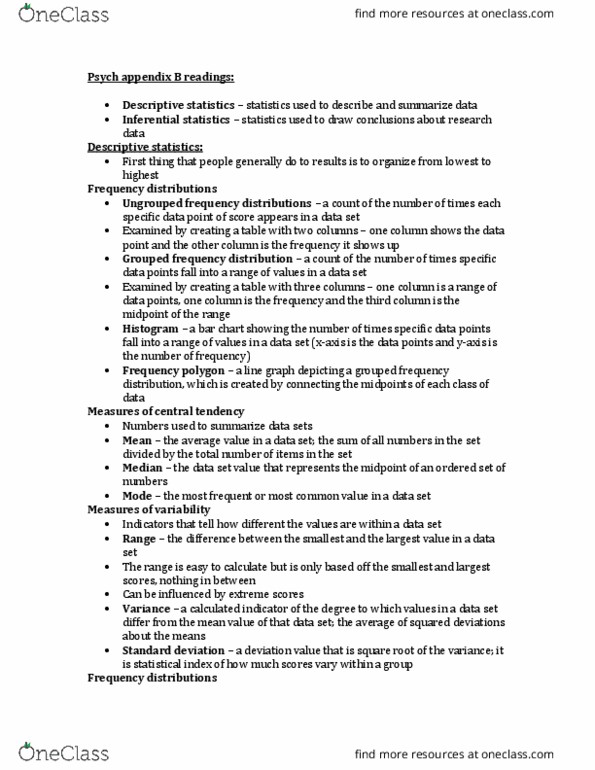
Descriptive statistics: stats used to describe and summarize data. Summarize data sets by creating frequency distributions. Ungrouped frequency distribution and grouped frequency distribution. Ungrouped: a count of the number of times each speci c data point or score appears in a data set; [variable;frequency] Grouped: a count of the number of times speci c data points fall into a range of values in a data set; 5-20 classes (continuous) [class;frequency;midpoint] Histograms are commonly used to represent ungrouped frequency distributions. Histograms: a bar chart showing the number of times speci c data points fall into range of values in a data set; x axis = values y axis = frequencies. Frequency polygon: line graph depicting a grouped frequency distribution, created by connecting the midpoints of each class of data. A single number that represents the entire data set. Indicators that tell how different the values are within a data set.