BIOL 2060 Study Guide - Final Guide: Standard Deviation, Frequency Distribution, Descriptive Statistics

1 Feb 2019
School
Department
Course
Professor
Document Summary
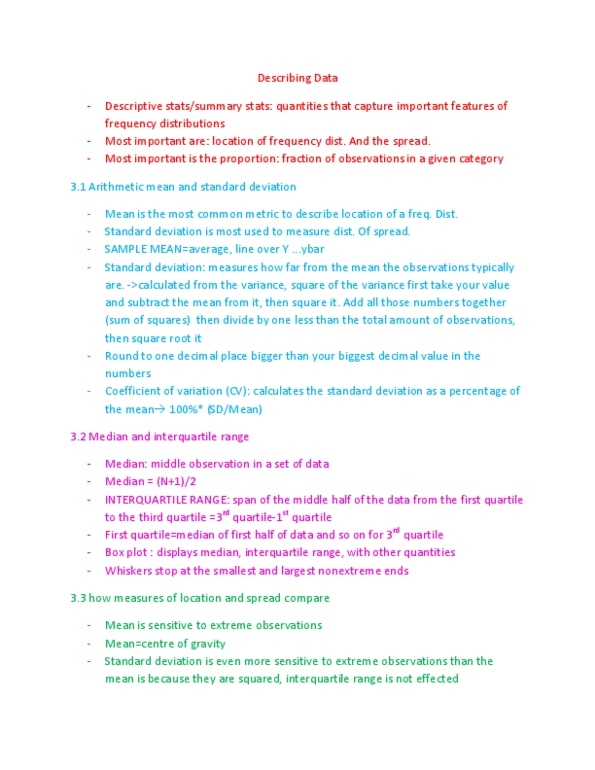
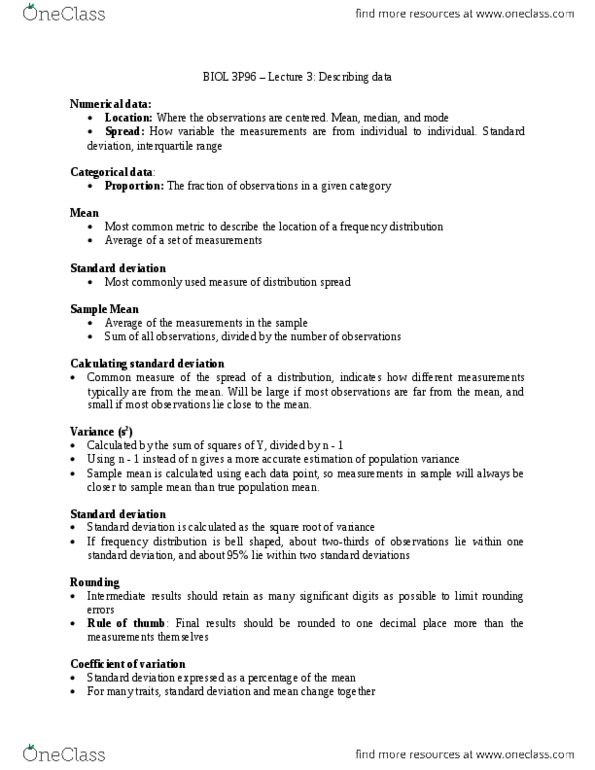
Chapter 3 - displaying data -- book work. Arithmetic mean - most common metric to describe the location of a frequency distribution; the average of a set of measurements. Y1 = 0. 9 y2 = 1. 4 y3 = 1. 2 y4 = 1. 2 y5 = 1. 3 y6 = 2. 0 y7 = 1. 4 y8 = 1. 6. The sample mean is symbolized as y (y bar) Sigma (uppercase) means sum i =1 under the and the n over it indicates that we are summing over all values of i between 1 and n, inclusive. It is a more intuitive measure of spread of distribution, but variance has a mathematical property that makes it useful sometimes. Formula for sum of squares: variance has units equal to the square of the units of the original data, the standard deviation is always positive and has the same units as the observations from which it was calculated.