CHEM 156 Study Guide - Final Guide: Molar Mass Distribution, Permeation, Elution


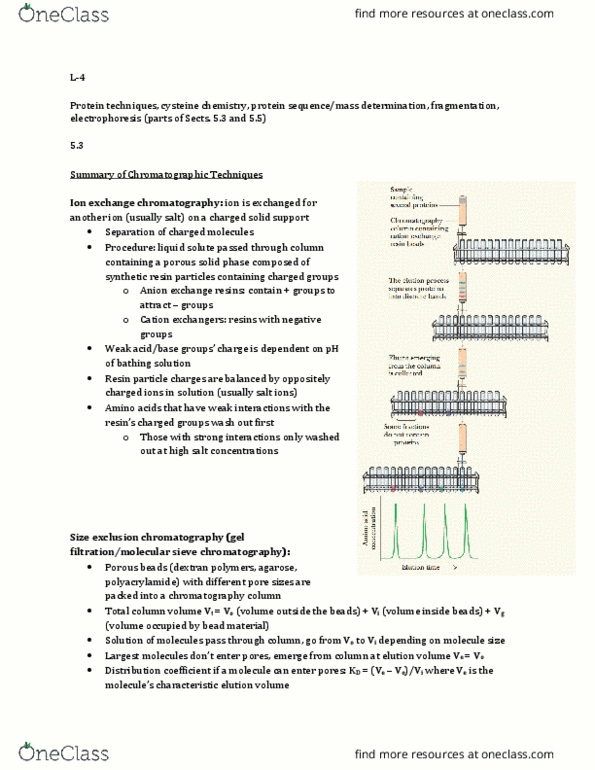
Separates molecules in solution by their effective size
•
Resin first dissolved in appropriate solvent
•
Dissolved resin injected into continually flowing stream of solvent (mobile
phase)
•
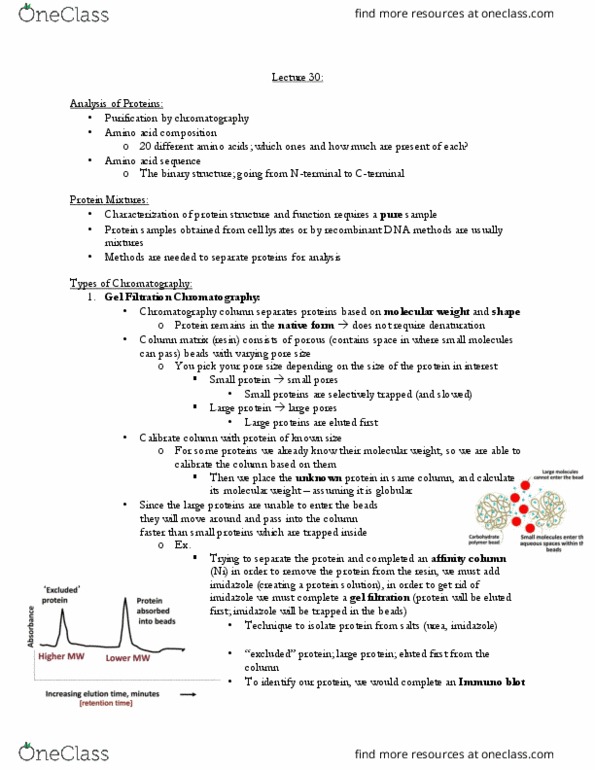
Mobile phase flows through many highly porous, rigid particles (stationary
phase)
•
Pore sizes ranges from large to small
•
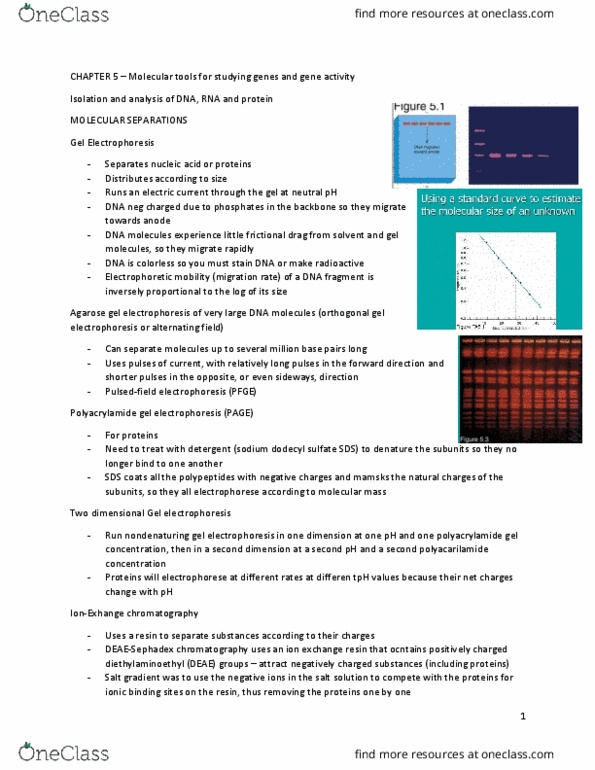
Molecule size distribution →width of the individual peaks
•
Distribution curve is known as the molecular weight distribution (MWD)
curve
•
Peaks represent molecular weight distribution of a sample
•
Broader peak = broader MWD
•
Higher average molecular weight = further along the molecular weight axis
the curve shifts
•
How it works:
Chromatogram: trace in the form of various peaks representing each of the
components in a sample
•
Molecules always emerge from the instrument and appear on the
chromatogram in descending order of molecular size
•
Average molecular weight: distance from injection point of chromatogram to
midpoint of molecular weight distribution curve
•
Any change in placement or shape of molecular weight distribution curve =
change in molecular makeup of polymer and its processing and performance
behavior
•
Effects of high and low MW components on some polymer properties:
•
Polymer property
As high MW
components increase:
As low MW
components increase:
Tensile strength
increases
decreases
viscosity
increases
decreases
Required processing
temperature
higher
lower
Chemical resistance
Increases
decreases
Two or more peaks in the polymer region of chromatogram →blend of two
or more polymers with different molecular weight distributions; or presence
of a single polymer polymerized under more than one set of reaction
•
How to use GPC:
Gel Permeation Chromatography
Thursday, June 14, 2018
2:20 AM
Chem 156 Page 1
Document Summary
Separates molecules in solution by their effective size. Dissolved resin injected into continually flowing stream of solvent (mobile phase) Mobile phase flows through many highly porous, rigid particles (stationary phase) Molecule size distribution width of the individual peaks. Distribution curve is known as the molecular weight distribution (mwd) curve. Peaks represent molecular weight distribution of a sample. Higher average molecular weight = further along the molecular weight axis the curve shifts. Chromatogram: trace in the form of various peaks representing each of the components in a sample. Molecules always emerge from the instrument and appear on the chromatogram in descending order of molecular size. Average molecular weight: distance from injection point of chromatogram to midpoint of molecular weight distribution curve. Any change in placement or shape of molecular weight distribution curve = change in molecular makeup of polymer and its processing and performance behavior. Effects of high and low mw components on some polymer properties: