PSYC 202 Chapter Notes - Chapter 8: Type I And Type Ii Errors, Null Hypothesis, Statistical Hypothesis Testing

15 Jun 2018
School
Department
Course
Professor

Hypothesis testing – comparing data to a null hypothesis and develop a null distribution
If the data are unlikely – reject the null hypothesis
If data are likely then fail to reject the null
Null can never be accepted
4 steps in hypothesis testing
- State the null and alternative hypothesis
- Establish the null distribution and test statistic
- Conduct the statistical test
o Decide on a significant threshold under the null hypothesis this is called the alpha
value
▪
▪
o Calculate the probability of observing your sample mean under the null
hypothesis—called the P-value
▪
▪
o Compare these two probabilities or test scores
▪ If P is less than or equal to alpha, then we reject the null hypothesis
▪ If P is greater than alpha, then we fail to reject the null hypothesis
▪
▪

- Draw conclusions
o
Error rates
- Made mistake in drawing statistical conclusions
Type 1 error
- Reject null hypothesis when it is true
- False positives
Type II error
- Failing to reject the null hypothesis when it is false
- False negatives
8.2
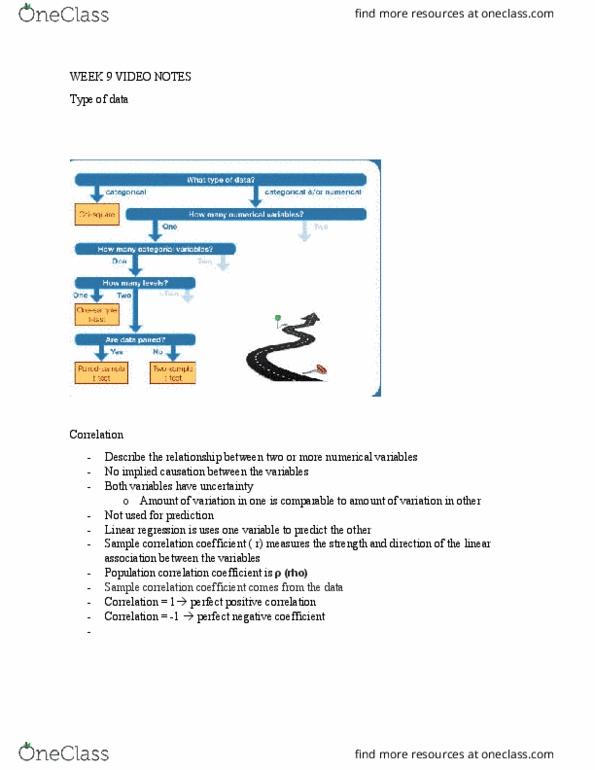
Two types of t tests for evaluating differences between two groups
- Paired
o Good for a study where you have used two treatments or looked at two different
things on a single sampling unit.
o Sampling unit is the difference between each pair of measurements
o Calculate the mean difference and the standard deviation of the differences
H0 = null hypothesis
Correct means made the correct
decision
Document Summary
Hypothesis testing comparing data to a null hypothesis and develop a null distribution. If the data are unlikely reject the null hypothesis. If data are likely then fail to reject the null. Establish the null distribution and test statistic. If p is less than or equal to alpha, then we reject the null hypothesis. If p is greater than alpha, then we fail to reject the null hypothesis. Reject null hypothesis when it is true. Failing to reject the null hypothesis when it is false. Two types of t tests for evaluating differences between two groups. The number of sampling units that we would expect in each of the bins given the null hypothesis. Calculate the total for the values in the table as well as the row and column totals. Divide the column and row totals by the whole total value.