ITM 410 Chapter Notes - Chapter 4,10,11: Data Flow Diagram, System Context Diagram, Business Process

25 Feb 2020
School
Department
Course
Professor

1
Tb ch 4,10,11(lec 3,4,5) business process design
DFD(data flow diagram): graphical representation of a system, depicts components; data flows; and sources, above
symbols used for DFD
Context diagram: 1st type of DFD, top level diagram of system depicting system and all activities as a single bubble and
showing data flows from external activities
Physical data flow diagram: graphical representation of system showing the systems internal and external entities and
flows of data into and out of these entities. Shows system infrasturcture
- Specify where, how, and by whom a systems activities are accomplished. NOT what activities

2
Logical data flow diagram: showing systems processes as bubbles, data stores and the flows of data into and out of the
processes and data stores, used to represent systems activities
- Specifies what activities system performs NOT how, where or by whom
- Allows us to concentrate on activities rather than how ex. Is the payment in the form of check, cash or credit- we
don’t know.
DFD balanced: when 2 DFDs have equivalent external data flows
Top-down positioning: subdividing or exploding of logical DFD

3
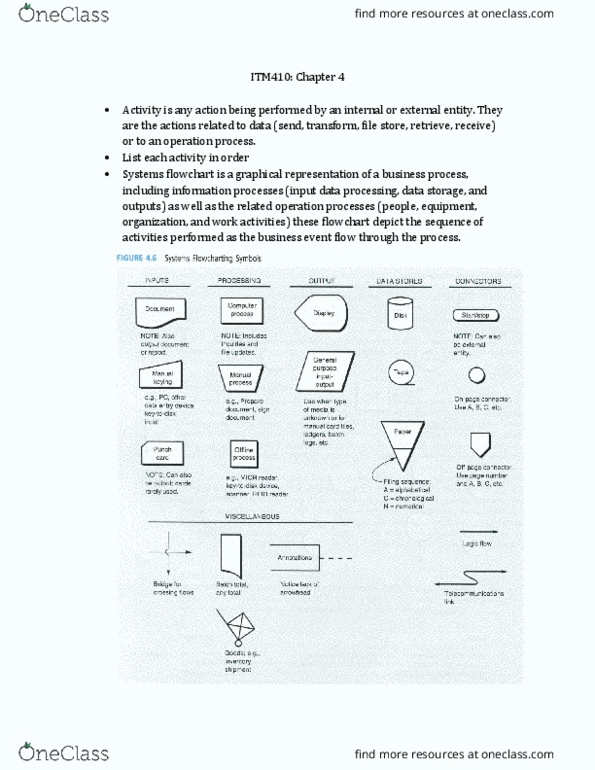
Systems flowchart: graphical representation of bus process including info processes (inputs, data processing, storage,
output) and operations processes (ppl, equip, org), depict sequence of activities
narrative: the data entry clerk keys an input document
into a computer. The computer accesses data in data
store 1 and in data store 2 to edit/validate the input,
including any errors. Clerk compares the input
document to the display, keys corrections as
necessary, and accepts the input. The computer
updates the table of data in the data store 2 and
notifies clerk input has been recorded
Document Summary
Dfd(data flow diagram): graphical representation of a system, depicts components; data flows; and sources, above symbols used for dfd. Context diagram: 1st type of dfd, top level diagram of system depicting system and all activities as a single bubble and showing data flows from external activities. Physical data flow diagram: graphical representation of system showing the systems internal and external entities and flows of data into and out of these entities. Specify where, how, and by whom a systems activities are accomplished. Logical data flow diagram: showing systems processes as bubbles, data stores and the flows of data into and out of the processes and data stores, used to represent systems activities. Specifies what activities system performs not how, where or by whom. Allows us to concentrate on activities rather than how ex. Is the payment in the form of check, cash or credit- we don"t know. Dfd balanced: when 2 dfds have equivalent external data flows.