STAT 100 Chapter Notes - Chapter 10: Pie Chart, Categorical Variable, Descriptive Statistics

9 Dec 2013
School
Department
Course
Professor


8
STAT 100 Full Course Notes
Verified Note
8 documents
Document Summary
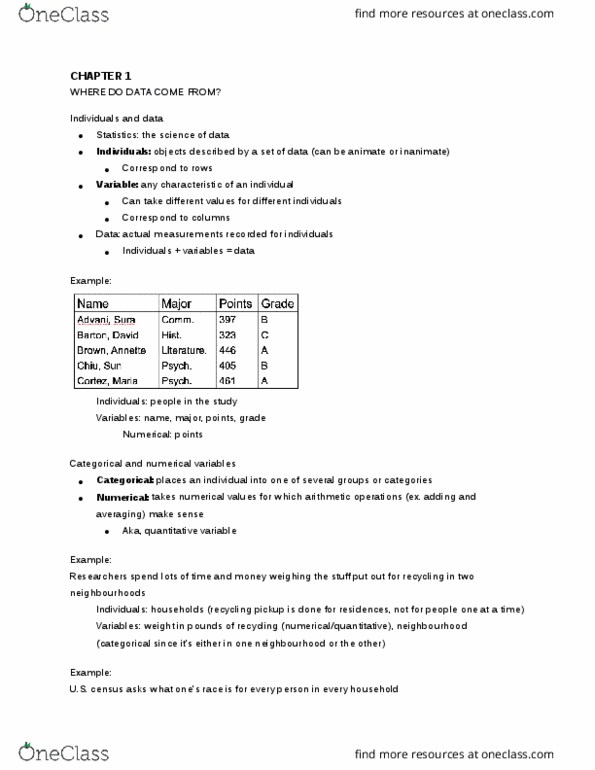
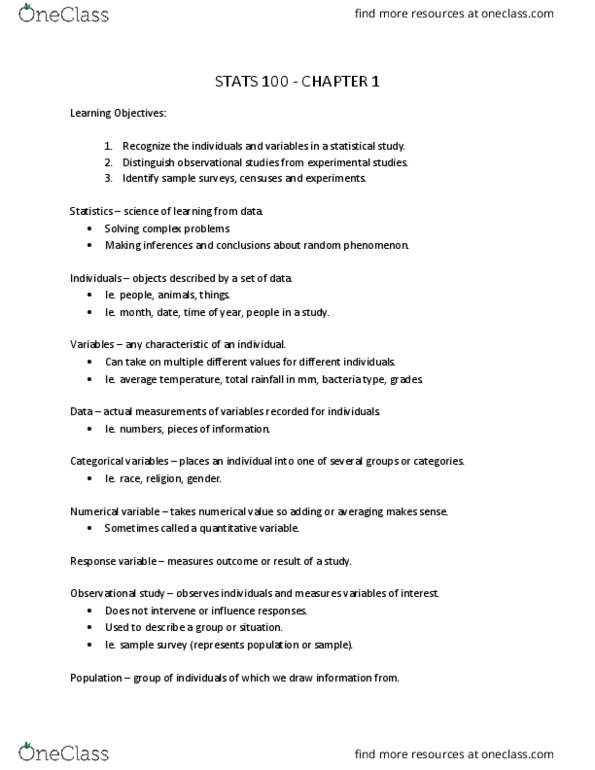
Statistics has developed a variety of tools for collecting and understanding data. So far we have discussed ways to collect data. Want to describe or summarize in a clear and concise way. Will first focus on descriptive statistics (graphical and numeric) Data sets contain information/facts relating to individuals. Distribution of a variable tell us what value a variable can take and how often it will take these values. Two main types of variables: quantitative variables. Take on numeric values for which addition and averaging make sense (height, weight, income : categorical variables. Ordinal data is a special type of categorical data where categories have ordered in a natural way. Rate your preference for this course from 1(dislike) to 5 (enjoy greatly) Pictures (graphics) can be a powerful tool for summarizing data. A graph (or graphic) is any visual display of numbers. Data visualization is still an emerging field. Many different types of plots are used.