STAT151 Chapter 5: Standard Deviation as a Ruler and the Normal Model

21 Sep 2018
School
Department
Course
Professor


4
STAT151 Full Course Notes
Verified Note
4 documents
Document Summary
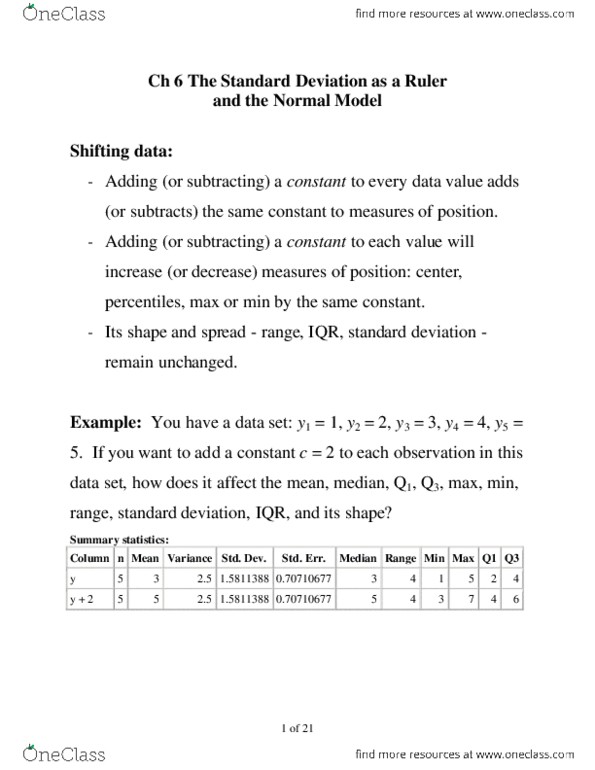
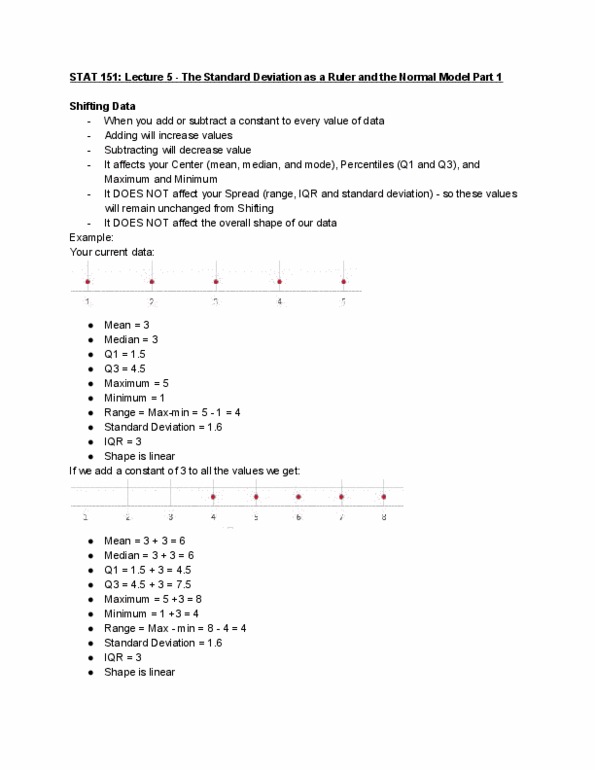
Adding/subtracting a constant to every data value adds/subtracts the same constant to. Adding/subtracting a constant to each value will increase/decrease measures of position measures of position (such as centre, percentiles, max, min by the same constant) But overall, the spread and shape will not change (range, iqr, standard deviation) Summary: c changes the mean, median, min, max, q1 and q3, but does not influence n, standard deviation, and rage (shape and spread remain the same) Multiplying or dividing data values by any constant , all measures of position (mean, median, percentiles and measures of spread (range, iqr, standard deviation) are multiplied or divided by that same constant. Example: y1 = 1 y2=2 y3 = 3 y4=4 y5=5. Y(new)=d*y(original) for each observation and measures of position, spread and shape. If you rescaled for shift data, then it would be y(new)=d*y(original) + c for each observation.