STAT151 Chapter Notes - Chapter 3: Bar Chart, Unimodality, Supreme Headquarters Allied Powers Europe

19 Jan 2016
School
Department
Course
Professor


4
STAT151 Full Course Notes
Verified Note
4 documents
Document Summary
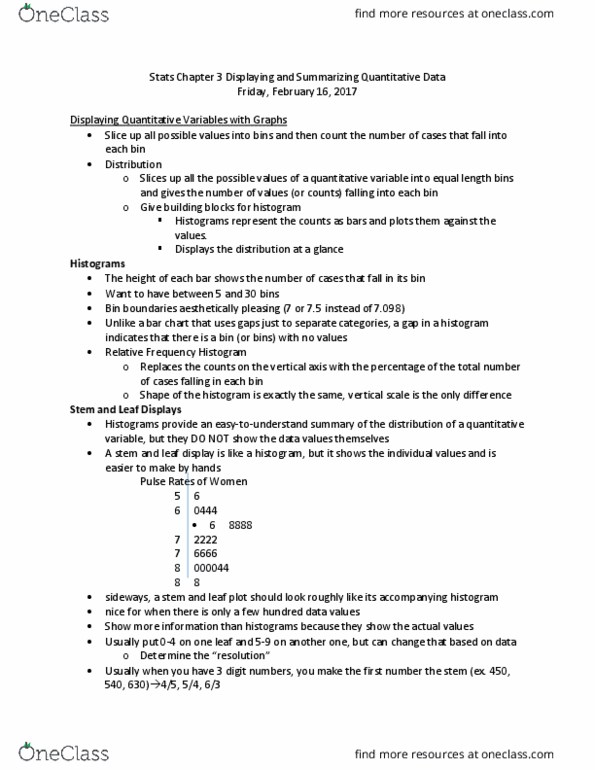
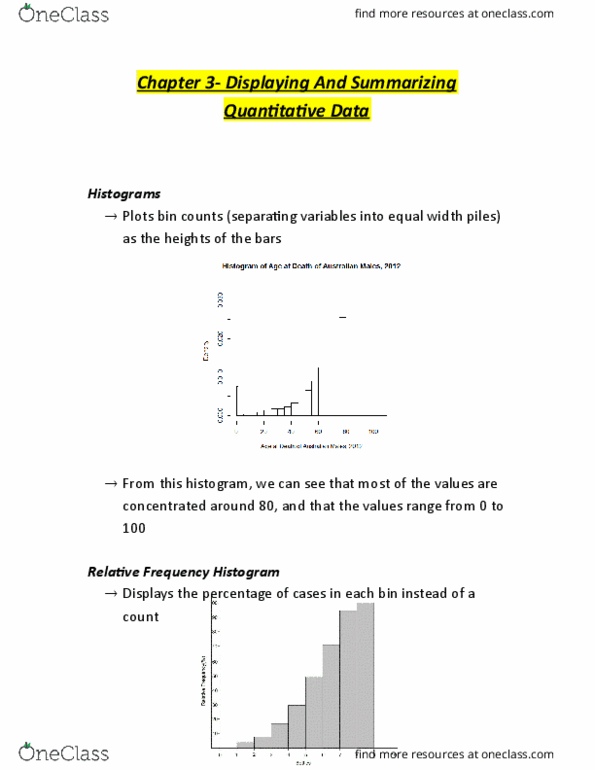
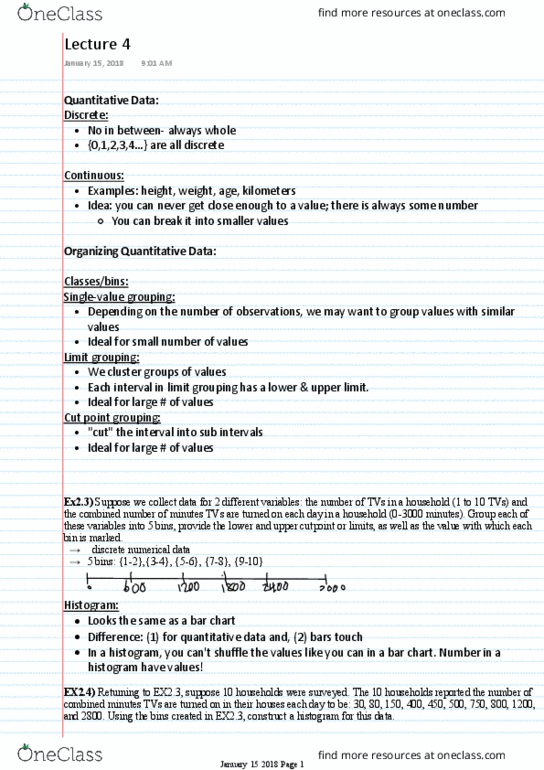
Categorical variables are very easy to show the distribution of because it"s easy and makes sense to do so. From this distribution, we are able to make a histogram. Histogram: uses bars to shower the distribution of a quantitative value: where a bar chart uses gaps to separate the different categories, a histogram doesn"t have any gaps. Unless there is an empty bin (one with no values in it) Relative frequency histogram: a histogram that shows the percentage (%) of the total number of the cases in each bin instead of the numerical value o. The percentage is placed on the vertical axis. A stem-and-leaf display is very similar to a histogram, but shows individual values. In this example table, the numbers on the left before the line are the stems and the numbers on the right are the. You bring them together to get your results.