ACCT 2230 Chapter Notes - Chapter 4: Operating Leverage, Earnings Before Interest And Taxes, Contribution Margin

19 Oct 2016
School
Department
Course
Professor
Document Summary
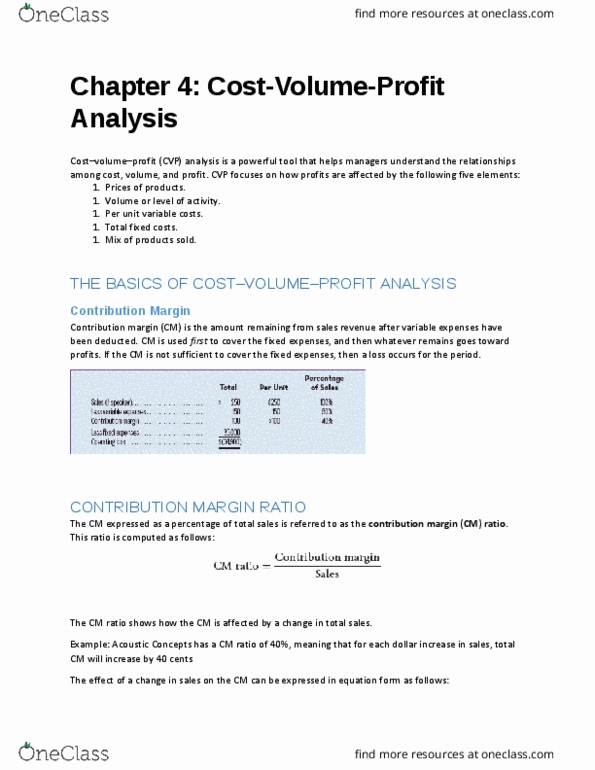
Cost-volume-profit (cvp): analysis is a powerful tool that helps managers understand the relationship among cost, volume, and profit. Cvp focuses on how profits are affected by the following five elements: prices of products, volume or level of activity, per unit variable costs, total fixed costs, mix of products sold. Is the amount remaining from sales revenue after variable expenses have been deducted. This is the amount available to cover fixed expenses and then provide profits or the period. If cm is not sufficient to cover the fixed expenses, then a loss occurs for the period. Is the level of sales at which profit is zero. Relationships among revenue, cost, profit, and volume can be expressed graphically by a cost-volume-profit (cvp) graph. A cvp graph is sometimes referred to as a break-even chart. Unit volume is commonly represented on the horizontal x-axis and dollars on the vertical y-axis.