ECON 1050 Chapter 5: Economics-1 (1) (dragged) 2

17 Sep 2016
School
Department
Course
Professor
Document Summary
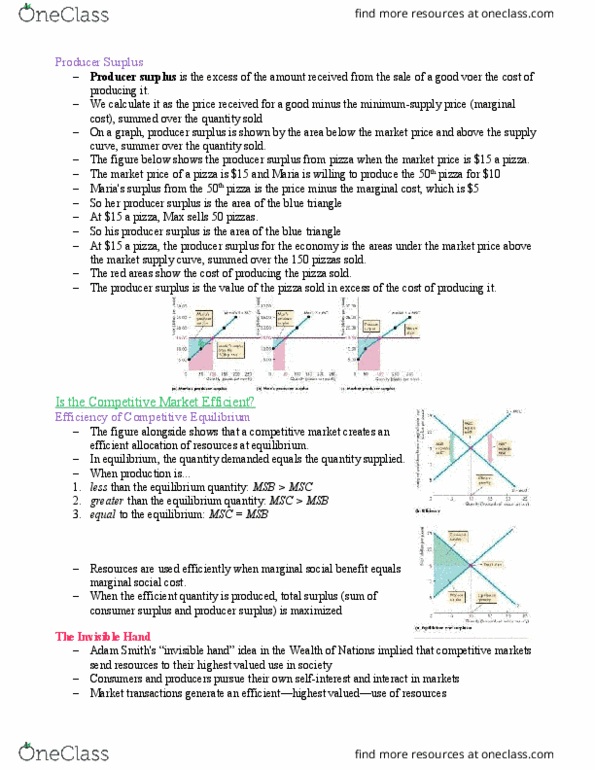
It is measured by the area under the demand curve and above the price paid, up to the quantity bought. The figure below, shows the consumer surplus from pizza when the market price is a slice. Lisa and nick pay the market price, which is a slice. The value lisa places on the 10th slice is . Lisa"s consumer surplus from the 10th slice is the value minus the price, which is , she buys. So her consumer surplus is the area of the green triangle. At a slice, nick buys 10 slices. So his consumer surplus is the area of the green triangle. At a slice, the consumer surplus for the economy is green area under the market demand curve above the market price, summer over the 40 slices bought. At a slice, lisa spends , nick spends , and together they spend on pizza.