COMM 291 Chapter Notes - Chapter 5: Unimodality, Standard Deviation, Box Plot


16
COMM 291 Full Course Notes
Verified Note
16 documents
Document Summary
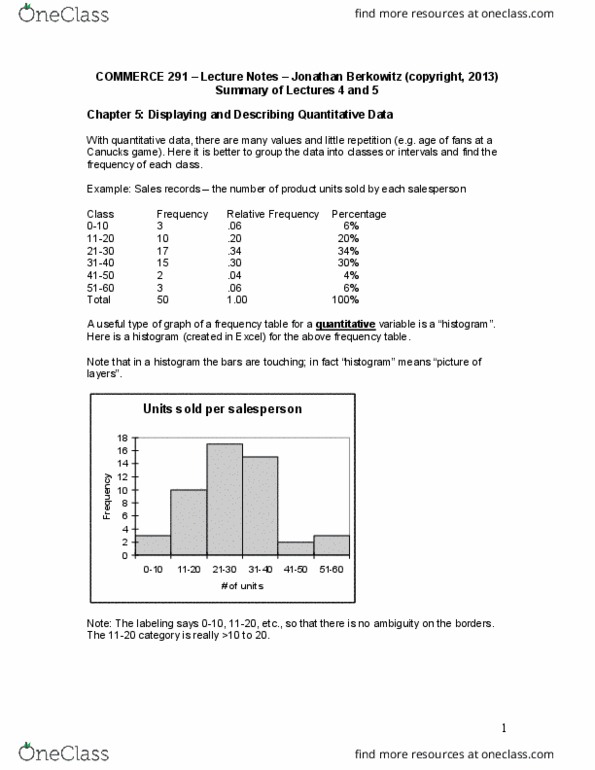
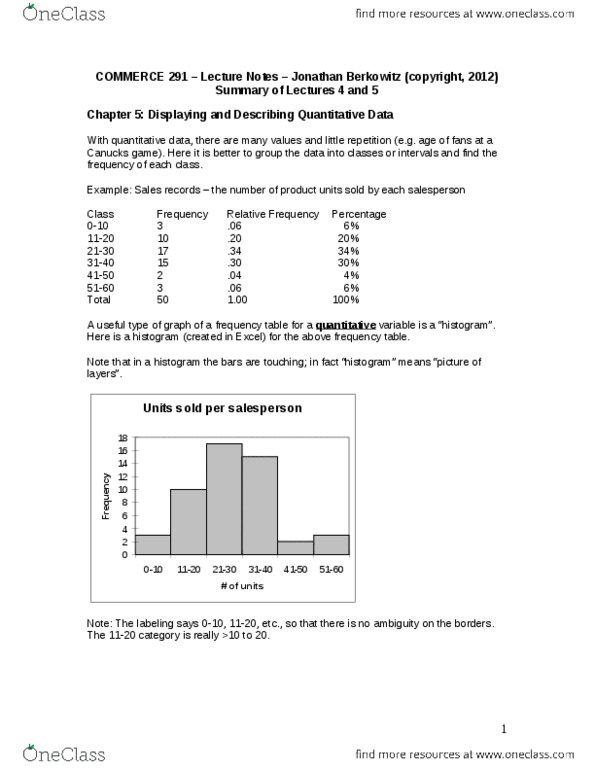
Comm291 - chapter 5 - displaying and describing quantitative data. Distribution gives the possible values of a variable and the frequency/relative frequency of each value. Histogram plots the bin counts as the heights of bars and counts the number of cases that fall into each bin and displays that as at the heigh of the corresponding bar. Bin choice is important because you can make distribution features appear more obvious then others. Relative frequency histogram is faithful to the area principle by displaying the percentage of cases in each bin instead of the count. Are like histograms but they also give the individual values. Easy to make by hand with data sets that aren"t too large. The numbers in each bin make up the bar. When making, you must check the quantitative data condition and check that the data are values of a quant variable whose units are known.