MGAB02H3 Chapter Notes - Chapter 9: Intangible Asset, Book Value, Historical Cost
35 views4 pages

Document Summary
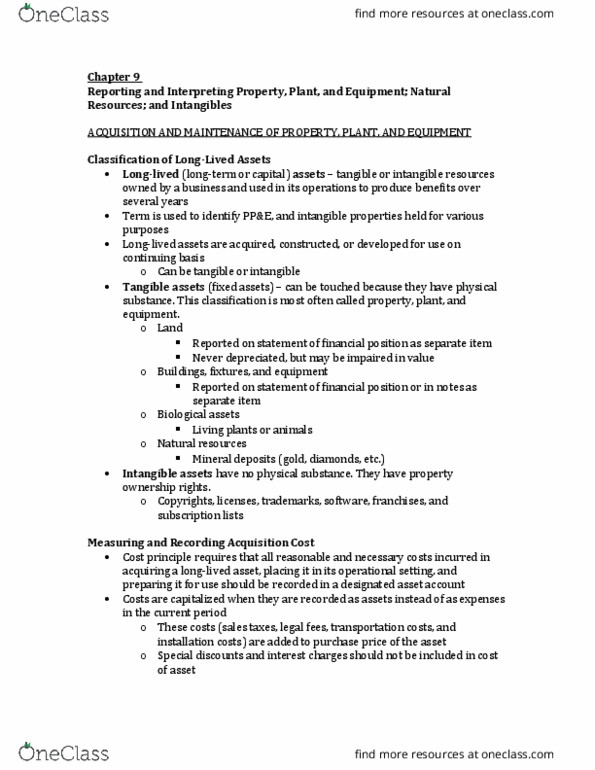
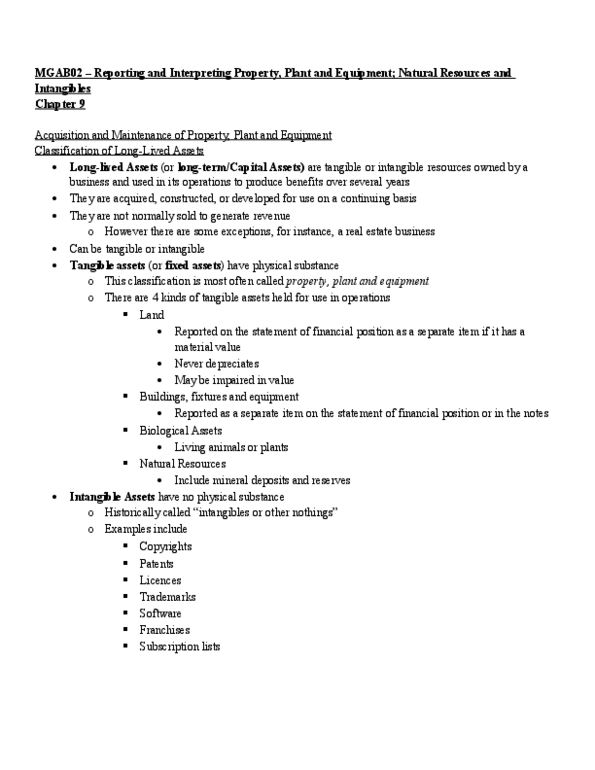
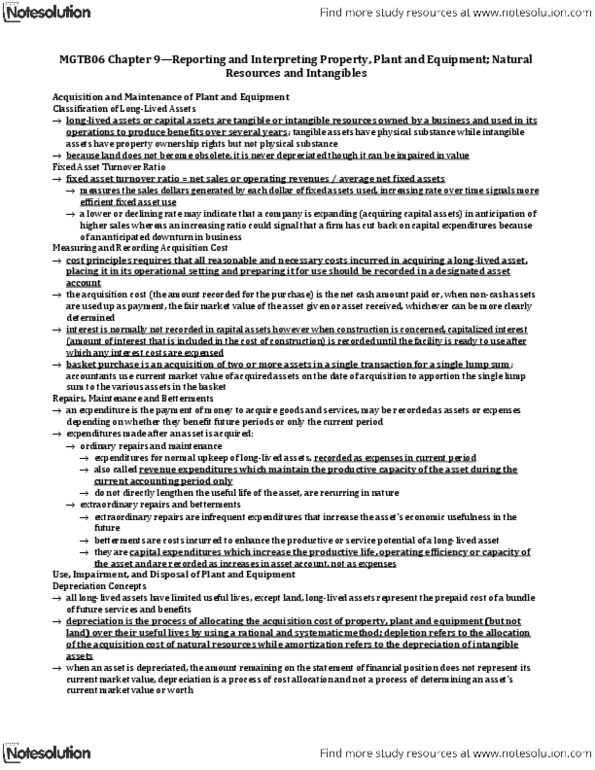
Chapter 9: reporting and interpreting property, plant, and equipment; natural resources; and. Long-lived assets: are tangible or intangible resources owned by a business and used in its operations to produce benefits over several years. Fixed asset turnover = net sales / average net fixed assets. Cost must be recorded at their acquisition cost according to cost principle. Special discounts and interest charges should not be included in the cost. Sales taxes, legal fees, transportation costs, and installation costs are added to the purchase price of the asset. Acquisition cost: the net cash equivalent amount paid or to be paid for the asset. Capitalized interest: represents interest on borrowed funds directly attributable to construction until the asset is ready for is intended use. Basket purchase: an acquisition of two or more assets in a single transaction for a single lump sum. Ordinary repairs and maintenance: expenditures for normal operating upkeep of long-lived assets.
Get access
Grade+20% off
$8 USD/m$10 USD/m
Billed $96 USD annually

Homework Help
Study Guides
Textbook Solutions
Class Notes
Textbook Notes
Booster Class
40 Verified Answers
Class+
$8 USD/m
Billed $96 USD annually

Homework Help
Study Guides
Textbook Solutions
Class Notes
Textbook Notes
Booster Class
30 Verified Answers
Related Documents
Related Questions

I need 10 Finanical Ratio's and benchmarks see list below forAllscript Health Solutions finiacial data included ratios and anindustry benchmark, and a dashboard (1 page graphicalrepresentation of 5 ratios). The analysis will include at leastthree recommendations on specific action that can be taken by theorganization to improve financial performance.
| CONSOLIDATED BALANCE SHEETS -USD ($) $ in Thousands | Dec. 31, 2015 | Dec. 31, 2014 | Dec.31,2013 |
| Current assets: | |||
| Cash and cash equivalents | $ 116,873 | $ 53,173 | $62,954 |
| Accounts receivable, net ofallowance of $31,266 and $36,047 as of December 31, 2015 and 2014,respectively | 327,851 | 331,625 | 313,486 |
| Prepaid expenses and othercurrent assets | 93,622 | 102,392 | 107,911 |
| Total current assets | 538,346 | 487,190 | 539,819 |
| Long-term marketablesecurities | 0 | 1,305 | 1,329 |
| Fixed assets, net | 125,617 | 145,830 | 174,013 |
| Software development costs,net | 85,775 | 86,153 | 88,244 |
| Intangible assets, net | 347,646 | 403,362 | 455,971 |
| Goodwill | 1,222,601 | 1,200,746 | 1,189,585 |
| Deferred taxes, net | 2,298 | 1,984 | 7,361 |
| Other assets | 359,665 | 137,760 | 163,341 |
| Total assets | 2,681,948 | 2,464,330 | 2,619,662 |
| Current liabilities: | |||
| Accounts payable | 60,004 | 70,824 | 72,956 |
| Accrued expenses | 62,021 | 78,967 | 96,499 |
| Accrued compensation andbenefits | 62,398 | 51,062 | 80,196 |
| Deferred revenue | 315,925 | 293,022 | 251,038 |
| Current maturities oflong-term debt and capital lease obligations | 12,609 | 27,498 | 16,350 |
| Total current liabilities | 512,957 | 521,373 | 517,039 |
| Long-term debt | 612,405 | 539,193 | 545,133 |
| Deferred revenue | 20,273 | 23,168 | 29,080 |
| Deferred taxes, net | 22,164 | 21,119 | 79,694 |
| Other liabilities | 95,076 | 75,257 | 130,572 |
| Total liabilities | $ 1,262,875 | $ 1,180,110 | $1,301,518 |
| Commitments andcontingencies | |||
| Stockholdersâ equity: | |||
| Preferred stock: $0.01 parvalue, 1,000 shares authorized, no shares issued and outstanding asof December 31, 2015 and 2014 | $ 0 | $ 0 | $0 |
| Common stock: $0.01 par value,349,000 shares authorized as of December 31, 2015 and 2014; 266,545and 189,308 shares issued and outstanding as of December 31, 2015,respectively; 265,138 and 180,466 shares issued and outstanding asof December 31, 2014, respectively | 2,665 | 2,651 | 2635 |
| Treasury stock: at cost,77,237 and 84,672 shares as of December 31, 2015 and 2014,respectively | (189,753) | (278,036) | -278,036 |
| Additional paid-incapital | 1,789,449 | 1,749,593 | 1,716,847 |
| Accumulated deficit | (190,235) | (188,009) | -121556 |
| Accumulated othercomprehensive loss | (4,242) | (1,979) | -1745 |
| Total Allscripts HealthcareSolutions, Inc.'s stockholders' equity | 1,407,884 | 1,284,220 | 1,318,145 |
| Non-controlling interest | 11,189 | 0 | 0 |
| Total stockholders'equity | 1,419,073 | 1,284,220 | 1,318,145 |
| Total liabilities andstockholders' equity | $ 2,681,948 | $ 2,464,330 | 2,619,663 |
| CONSOLIDATEDSTATEMENTS OF OPERATIONS - USD ($) $ in Thousands | 12 Months Ended | ||
| Dec. 31, 2015 | Dec. 31, 2014 | Dec. 31, 2013 | |
| Revenue: | |||
| Software delivery, support andmaintenance | $ 918,430 | $ 907,343 | $ 918,686 |
| Client services | 467,963 | 470,530 | 454,375 |
| Total revenue | 1,386,393 | 1,377,873 | 1,373,061 |
| Cost of revenue: | |||
| Software delivery, support andmaintenance | 291,804 | 312,898 | 325,471 |
| Client services | 432,038 | 437,776 | 427,933 |
| Amortization of softwaredevelopment and acquisition-related assets | 81,986 | 81,215 | 85,201 |
| Total cost of revenue | 805,828 | 831,889 | 838,605 |
| Gross profit | 580,565 | 545,984 | 534,456 |
| Selling, general andadministrative expenses | 339,175 | 358,681 | 419,599 |
| Research and development | 184,791 | 192,821 | 199,751 |
| Asset impairment charges | 1,544 | 2,390 | 11,454 |
| Amortization of intangible andacquisition-related assets | 23,172 | 31,280 | 31,253 |
| Income (loss) fromoperations | 31,883 | (39,188) | (127,601) |
| Interest expense | (31,396) | (29,297) | (28,055) |
| Other income, net | 2,183 | 766 | 7,310 |
| Equity in net earnings ofunconsolidated investments | (2,100) | (398) | 0 |
| Income (loss) before incometaxes | 570 | (68,117) | (148,346) |
| Income tax (provision)benefit | (2,626) | 1,664 | 44,320 |
| Net loss | (2,056) | (66,453) | (104,026) |
| Less: Net income attributableto non-controlling interest | (170) | 0 | 0 |
| Net loss attributable toAllscripts Healthcare Solutions, Inc. stockholders | $ (2,226) | $ (66,453) | $ (104,026) |
| Loss per share - basic anddiluted attributable to Allscripts Healthcare Solutions, Inc.stockholders | $ (0.01) | $ (0.37) | $ (0.59) |
| Capital Structure Ratios | ||||||||
| Capitalization ratios | ||||||||
| Equity ratio | ||||||||
| Capitalization ratio | ||||||||
| Fixed asset financingratio | ||||||||
| Coverage ratio | ||||||||
| Cash flow to toal debt | ||||||||
| Debt service coverage | ||||||||
| Cash flow coverage | ||||||||
| Cushion ratio | ||||||||
| Capital expense ratio | ||||||||

