Biology 2244A/B Chapter Notes - Chapter 3: Scatter Plot, Dependent And Independent Variables

25 Dec 2016
School
Department
Course
Professor
Document Summary
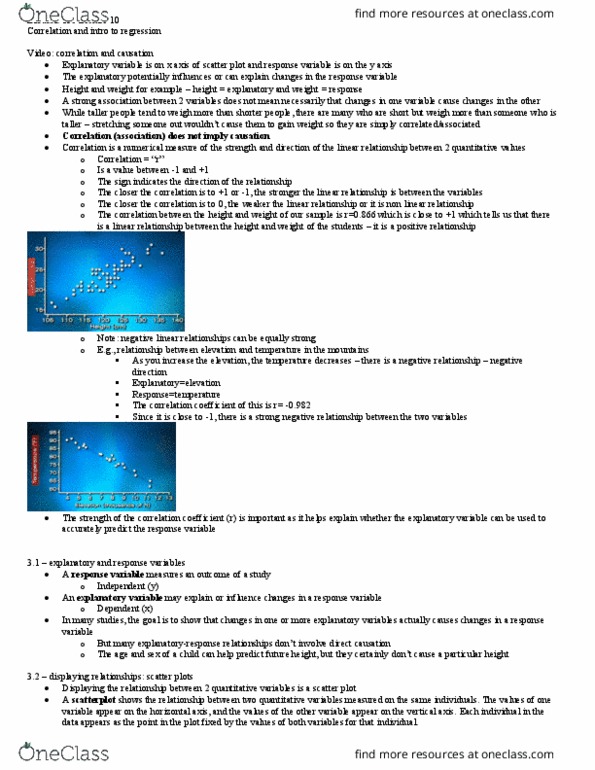
Relationship between 2 variables can be influenced by other confounding variables. The response variable depends on the explanatory variable. Goal: show changes in one or more explanatory variables cause change in response variable. Ex. age and sex can predict future height, but do not cause it. Scatterplot: most useful graph for displaying relationship between 2. Scatterplot: most useful graph for displaying relationship between 2 quantitative variables. Can plot two or more relationships on scatterplot. First, describe the relationship between x and y separately for each category, then compare and contrast these relationships. Scatterplot: displays direction, form and strength of relationship between 2 quantitative variables. Pearson"s correlation coefficient: r, the correlation between 2 variables. Ex. above average height correlated with above average weight. Correlation makes no distinction between explanatory and response variables variables i. Doesn"t matter what x and y is when calculating correlation. R does not change when we change units of measurement i. ii.