Sociology 2205A/B Chapter Notes - Chapter Chapters 4,5,6: Sampling Probability, Statistical Inference, General Social Survey

11 Jan 2018
School
Department
Course
Professor
Document Summary
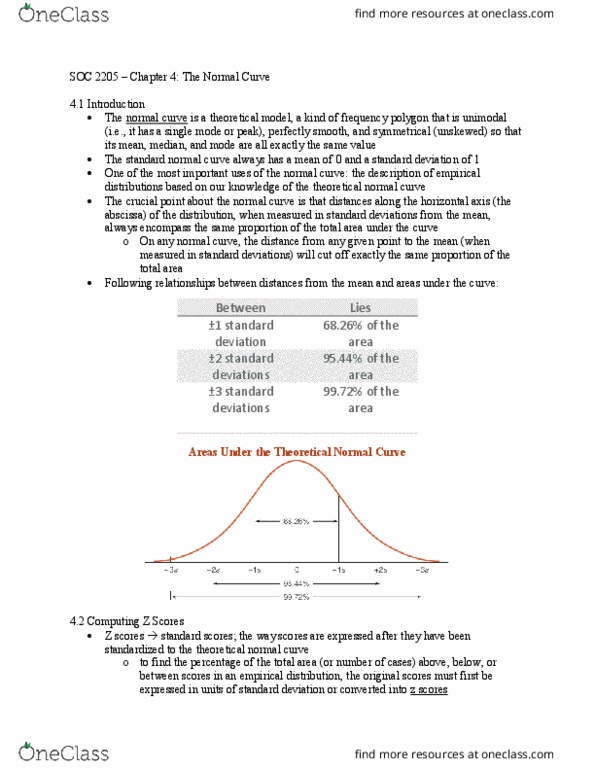
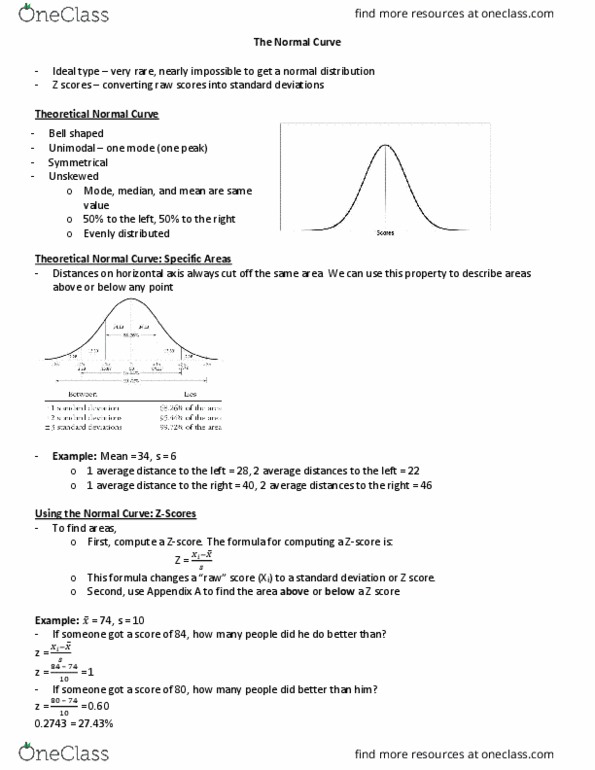
Introduction: normal curve: a theoretical distribution of scores that is symmetrical, unimodal, and bell shaped. Finding total area above and below a score. The information presented in the table can also be used to find other kinds of areas in an empirical distribution of a variable in the sample (or population), provided that it is at least approximately normal in shape. For example, suppose you need to determine the total area below the scores of two male subjects in the sample distribution described in figure 4. 1. The a(cid:396)ea (cid:271)elo(cid:449) a z score of +0. 85 is therefore 80. 23% (50. 00% + 30. 23%). This subject scored higher than 80. 23% of the persons tested. Finding areas between two scores: on occasion, you will need to determine the area between two scores rather than the total area above or below one score. Therefore, the area between these two scores is 35. 31% 24. 22%, or 11. 09% of the total area.