Statistical Sciences 2035 Chapter 3.2: 3.2 - Measures of Variability Ungrouped Data

6 Oct 2017
School
Department
Professor
Document Summary
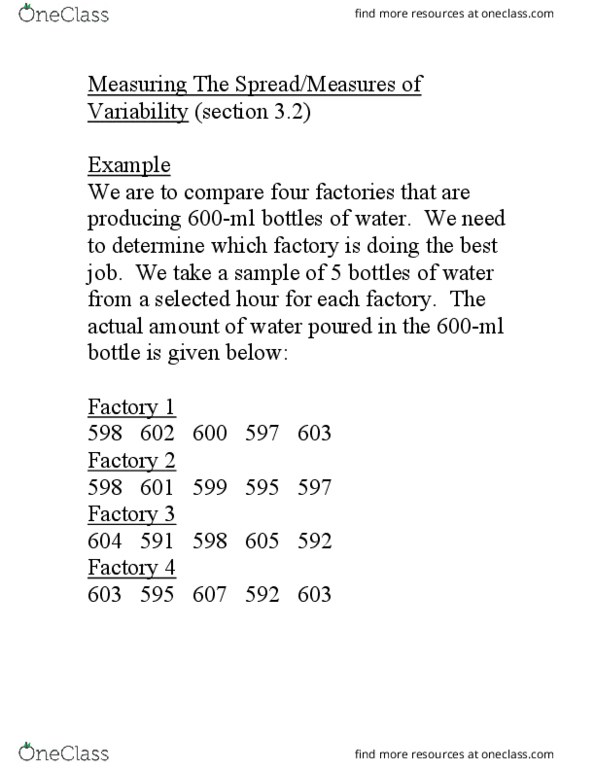
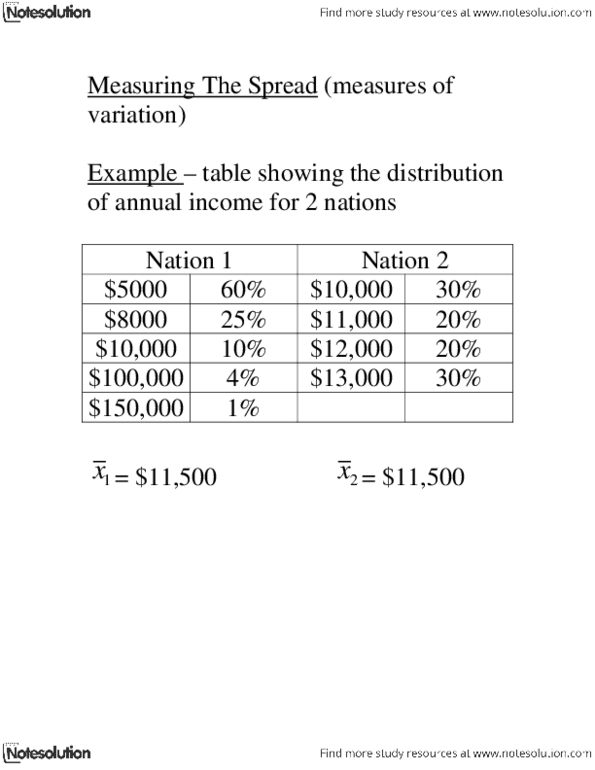
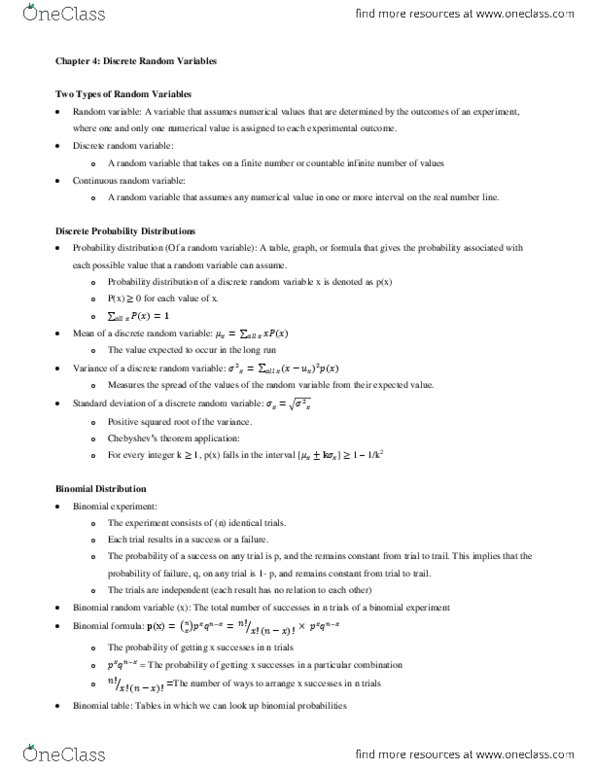
Measures of variability - describe the spread or the dispersion of a set of data. Using measures of variability in conjunction with measures of central tendency makes possible a more complete numerical description of the data. Range = difference between the largest value of a data set and the smallest value of the set. Crude measure of variability, describing the distance to the outer bounds of the data set. Advantage of the range is the ease of computation. Interquartile range = range of values between the first and third quartiles. Useful in situations where data users are more interested in values toward the middle and less interested in extremes. Iqr is used to make box and whisker plots. Other measures of variability are variance, standard deviation, and mean absolute deviation. These measures are not meaningful unless data are at least interval-level data. = subtract the mean from each data value yields the deviation from the mean.