Statistical Sciences 2244A/B Chapter Notes - Chapter 24: F-Test, Null Hypothesis, List Of Statistical Packages

22 May 2018
School
Department
Professor

Stats 2244
Chapter 24
CHAPTER 24.1
Comparing several means
- to compare these three population means, we might use the two-sample ttest several times:
o Test H0: μ1 = μ2 to see if the mean weight for chow differs from the mean weight for
restricted.
o Test H0: μ1 = μ3 to see if the mean weight for chow differs from the mean weight for
extended.
o Test H0: μ2 = μ3 to see if the mean weight for restricted differs from the mean weight for
extended.
- Statistical methods for dealing with multiple comparisons usually have 2 steps:
o An overall test to see if there is good evidence of any differences among the
parameterthat we want to compare
o A detailed follow up analysis to decide which of the parameters differ and to estimate
how large the differences are
CHAPTER 24.2
The analysis of variance F test
- We want to test the null hypothesis that there are no differences among the mean weights for the
three experimental populations of diet types:
H0: μ1 = μ2 = μ3
- The alternative hypothesis is that there is some difference. That is, not all three population
means are equal:
Ha: not all of μ1, μ2, and μ3 are equal
- Ha simply says that H0 is not true. The alternative hypothesis is no longer one-sided or two-
sided.
- It is nondirectional, because it allows any relationship other than all three equal.
- For example, Ha includes the case in which μ2 = μ3 but μ1 has a different value.
- The test of H0 against Ha is called the analysis of variance F test.
- Analysis of variance is usually abbreviated as ANOVA
- The ANOVA F test is almost always carried out with software that reports the test statistic and
its P-value
CHAPTER 24.3
Using Technology
LOOK AT THE TEXTBOOK IF YOU NEED THIS
CHAPTER 24.4
The idea of analysis of variance
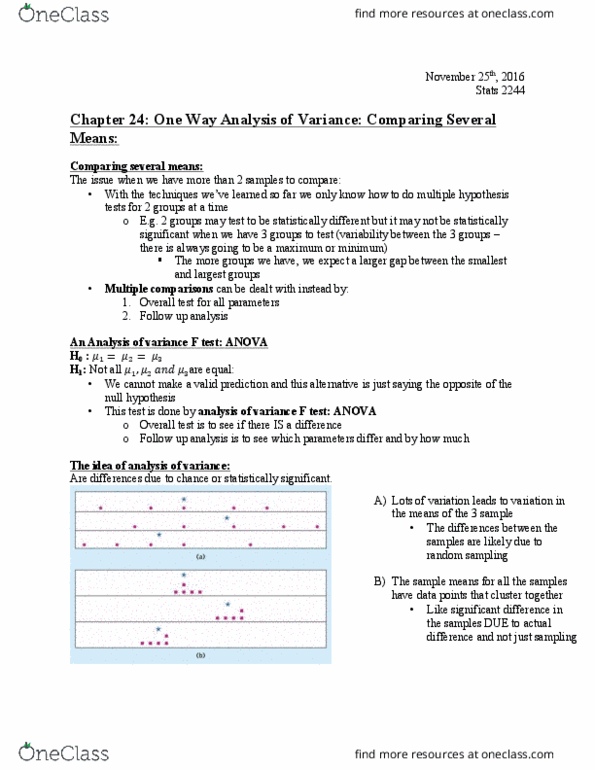
- When we ask if a set of sample means gives evidence for differences among the opulation
means, what matters is not how far apart the sample means are but how far apart they
are relative to the variability of individual observations
- Look at the two sets of dotplots below
o The sample means are marked with blue asterisks for ease of comparison
o Both sets of dotplots use the same scale and compare three samples with the same three
means.
o Could differences this large easily arise just due to chance, or are they statistically
significant?
o The dotplots in (a) show lots of variation among the individuals in each group
find more resources at oneclass.com
find more resources at oneclass.com

o With this much variation among individuals, we would not be surprised if another set of
samples gave quite different sample means
o The observed differences among the sample means could easily happen just by chance.
o The dotplots in (b) have the same means as those in (a), but there is much less variation
among the individuals in each group.
o It is unlikely that any sample from the second (b) group would have a mean as small as
the mean of the third (b) group.
o Because means as far apart as those observed would rarely arise just by chance in
repeated sampling, they are good evidence of real differences among the means of the
three populations from which we are sampling.
- Small differences among sample means can be significant if the samples are large. Large
differences among sample means can fail to be significant if the samples are small. All we can be
sure of is that, because the sample sizes in (a) and (b) are the same, (b) will give a much
smaller P-value than (a)
- But still, If sample means are far apart relative to the variation among individuals in the same
groups, that’s evidence that something other than chance is at work.
- The analysis of variance idea:
o Analysis of variance compares the variation due to specific sources with variation
among individuals who should be similar
o In particular, ANOVA tests whether several populations have the same mean by
comparing how far apart the sample means are with how much variation there is within
the samples
- The F statistic can take only values that are zero or positive
- It is zero only when all the sample means are identical and gets larger as they move farther
apart
- When H0 is true, the numerator and denominator should have similar values and we would
expect F to be small.
- F is large when the sample means are much more variable than individuals in the same sample.
- Large values of F are evidence against the null hypothesis H0 that all population means are the
same.
- Like the alternative hypothesis Ha, the ANOVA F test is nondirectional, because any violation
of H0 tends to produce a large value of F
CHAPTER 24.5
Conditions for ANOVA
- Conditions for ANOVA:
o We have k independent SRSs, one from each k population
o Each of the k populations has a normal distribution with an unknown mean
▪ The parameter μi is the unkown mean of the ith population
find more resources at oneclass.com
find more resources at oneclass.com
Document Summary
We want to test the null hypothesis that there are no differences among the mean weights for the three experimental populations of diet types: The alternative hypothesis is that there is some difference. That is, not all three population means are equal: Ha: not all of 1, 2, and 3 are equal. Ha simply says that h0 is not true. The alternative hypothesis is no longer one-sided or two- sided. It is nondirectional, because it allows any relationship other than (cid:498)all three equal. (cid:499) The test of h0 against ha is called the analysis of variance f test. Analysis of variance is usually abbreviated as anova. The anova f test is almost always carried out with software that reports the test statistic and. For example, ha includes the case in which 2 = 3 but 1 has a different value. its p-value. Look at the textbook if you need this.