EC255 Chapter Notes - Chapter 1: Statistical Inference, Qualitative Property, Parametric Statistics


1.2 Basic Statistical Concepts
• Statistics: a science dealing with the collection, analysis, interpretation, and presentation of
numerical data
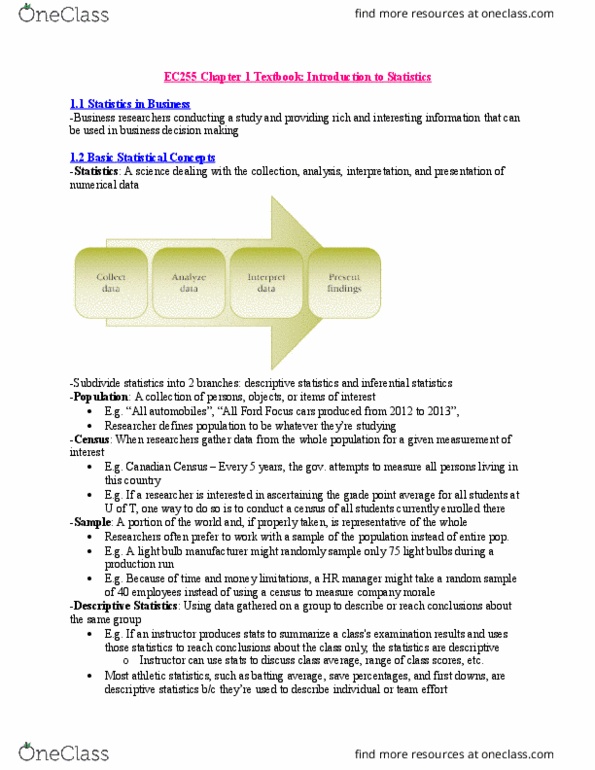
• Key elements of business statistics:
1. Collect data
2. Analyze data
3. Interpret data
4. Present findings
• Statistics are subdivided into two branches:
1. Descriptive
2. Inferential
• Population: a collection of persons, objects, or items of interest
o Can be widely or narrowly defined (e.g. all automobiles; all Ford Focus cars produced
from 2012 to 2013)
o Can be a group of people (e.g. all people employed by Microsoft)
o Can be a set of objects (e.g. all Toyota RAV4s produced in February 2013 by Toyota
Canada at Woodstock, ON plant)
o When researchers gather data from the whole population for a given measurement of
interest, it is called a census (e.g. researcher ascertains the GPA for all students at WLU
through a census)
• Sample: a portion of the whole/representation of the whole
o Researchers often prefer to work with a sample of the population
• Descriptive measure of the population is called a parameter
• Descriptive measure of a sample is called a statistic
• Differences between parameter and statistic only important in inferential statistics
o Basis for inferential statistics: ability to make decisions about parameters without having
to complete a census of the population
Descriptive Statistics
• Using data gathered on a group to describe or reach conclusions about that same group
• E.g. instructor produces statistics to summarize a class's examination results and uses those
stats to reach conclusions about that class only
o Can use this to discuss class average, range of class scores, etc.
• E.g. Most athletics statistics like batting average, save percentages, first downs
• E.g. # employees on vacation during June, average salary at the Edmonton office, corporate
sales for 2013
Inferential Statistics
• Gathering data from a sample and using the statistics generated to reach conclusions about the
population from which the sample was taken
• Data is used to infer something about a larger group
• Sometimes called inductive statistics
• E.g. pharmaceutical research
find more resources at oneclass.com
find more resources at oneclass.com
Document Summary
1. 2 basic statistical concepts: statistics: a science dealing with the collection, analysis, interpretation, and presentation of numerical data, key elements of business statistics, collect data, analyze data, present findings. Interpret data: statistics are subdivided into two branches, descriptive. Most athletics statistics like batting average, save percentages, first downs: e. g. # employees on vacation during june, average salary at the edmonton office, corporate sales for 2013. Researchers design experiments with small, randomly selected samples of patients and try to reach conclusions and make inferences about the population. 1. 4 data measurement: need to know the level of data measurement represented by the numbers being analyzed, four common levels of data measurement (nominal is lowest, ratio is highest), nominal, ordinal. Lowest level: numbers representing nominal-level data can be used only to classify or categorize, e. g. employee id numbers, many demographic questions in surveys result in nominal data bc questions are for classification only, e. g.