EC255 Chapter Notes - Chapter 5: Probability Distribution, Countable Set, Poisson Distribution


5.1 Discrete versus Continuous Distributions
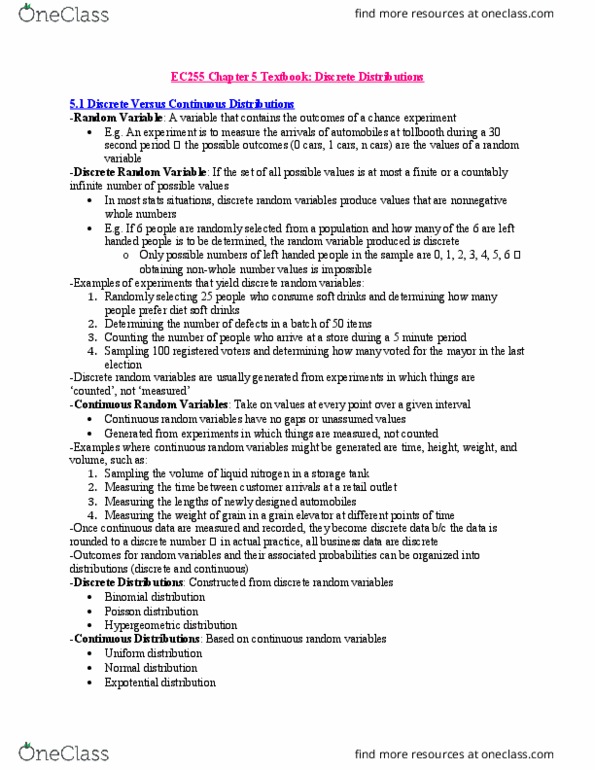
• Random variable: a variable that contains the outcomes of a chance experiment
o E.g. an experiment to measure the arrivals of cars at a tollbooth during a 30 second
period ad possile outoe are: ars, ar, ars,…, n cars
▪ These uers , , ,… n) are the values of a random variable
o Two categories: (1) discrete random variables (2) continuous random variables
Discrete Random Variable
• Discrete random variable: set of all possible values is at most a finite or a countably infinite
number of possible values
• Usually produce values that are nonnegative whole numbers
o E.g. six people are randomly selected from a population and how many of the six are
left-handed is to be determined, random variable produced is discrete (there cannot be
2.75 left-handed people, only 0, 1, 2, 3, 4, 5, 6)
• Experiments that are "counted" not "measured"
Continuous Random Variables
• Continuous random variables take on values at every point over a given interval
• No gaps or unassumed values
• Experiments that are "measured" not "counted"
o E.g. time it takes to assemble a product component – could be 3 minutes 36.4218
seconds
o E.g. time, height, weight, volume
• Once continuous data are measured and recorded, become discrete data bc data are rounded to
discrete number
Discrete and Continuous Distributions
• Outcomes for random variables and associated probabilities can be organized into distributions
• Two types of distributions:
1. Discrete distributions: constructed from discrete random variables
i. Binomial distribution
ii. Poisson distribution
2. Continuous distributions: based on continuous random variables
i. Uniform distribution
ii. Normal distribution
iii. Exponential distribution
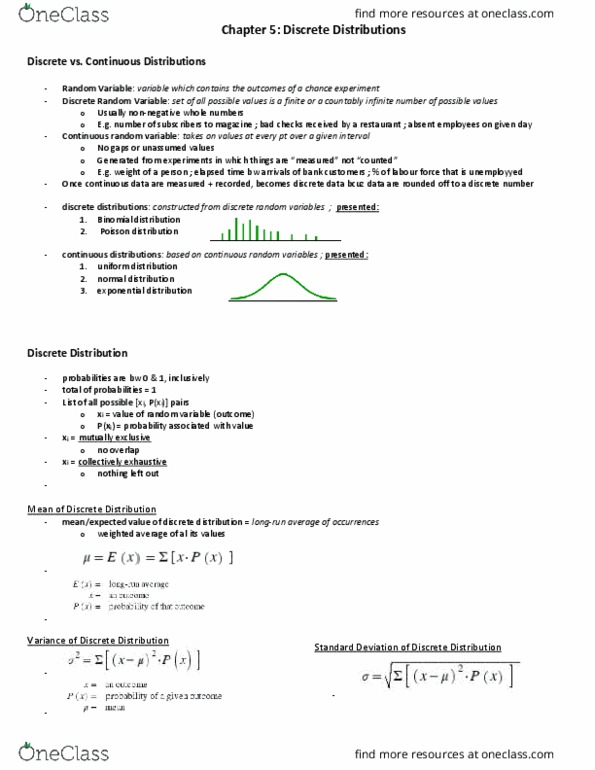
5.2 Describing a Discrete Distribution
• Histogram is most common graphical way to depict a discrete distribution
Mean, Variance, and Standard Deviation of Discrete Distributions
find more resources at oneclass.com
find more resources at oneclass.com
Document Summary
2. 75 left-handed people, only 0, 1, 2, 3, 4, 5, 6: experiments that are counted not measured 5. 2 describing a discrete distribution: histogram is most common graphical way to depict a discrete distribution. Mean or expected value: mean or expected value of a discrete distribution: the long-run average of occurrences where. E(x) = long-run average x = an outcome. Variance and standard deviation of a discrete distribution: variance of a discrete distribution: where, standard deviation is then computed by taking the square root of the variance: Mean and standard deviation of a binomial distribution: mean and standard deviation of a binomial distribution: Working poisson problems by formula: e. g. bank cusomers arrive randomly on weekday afternoons at an average of 3. 2 customers every 4 minutes. What is the probability of exactly 5 customers arriving in a 4-minute interval on a weekday afternoon: = 3. 2 customers per 4 minutes, x = 5 customers per 4 minutes.