EC255 Chapter Notes - Chapter 6: Probability Distribution, Normal Distribution, Standard Deviation


6.1 Uniform Distribution
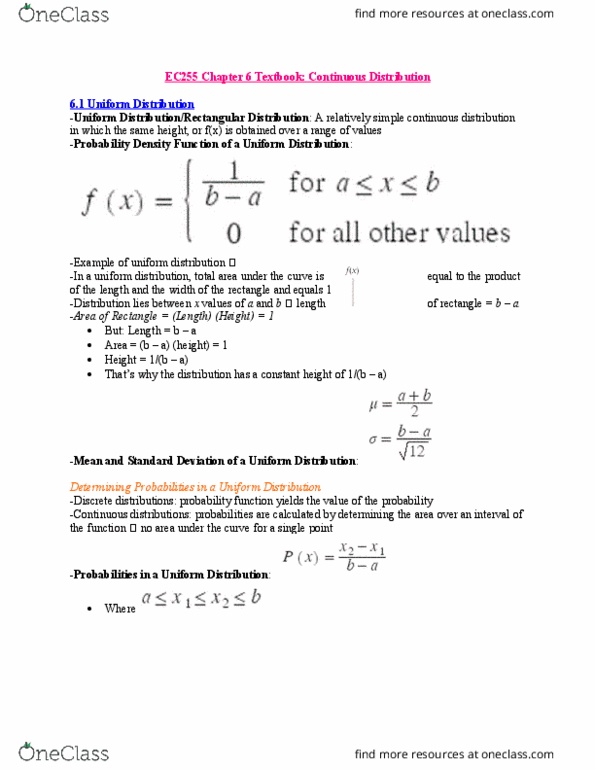
• Uniform distribution/rectangular distribution: a relatively simple continuous distribution in
which the same height, or f(x), is obtained over a range of values
• Probability Density Function of a Uniform Distribution:
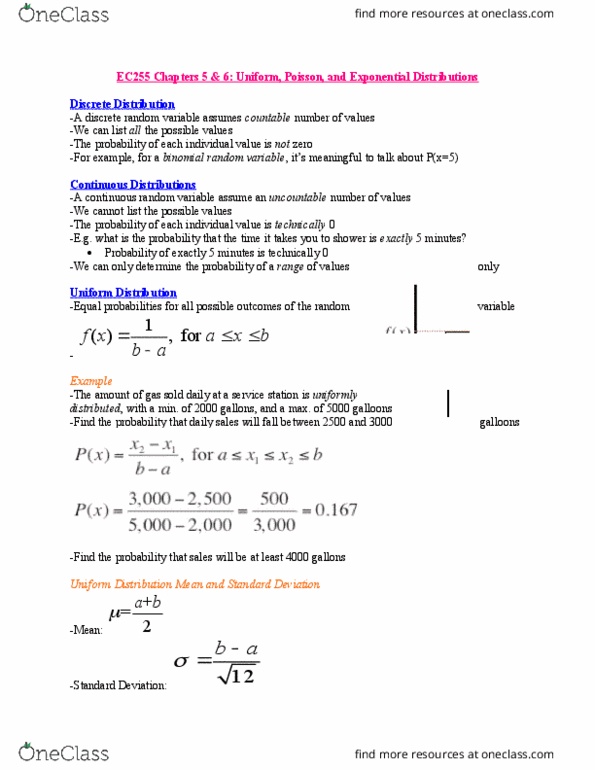
• Mean and Standard Deviation of a Uniform Distribution:
Determining Probabilities in a Uniform Distribution
• For continuous distributions, probabilities are calculated by determining the area over an
interval of the function
• Probabilities in a Uniform Distribution:
where
• Remember: area between a and b = 1
o Probability for any interval that includes a and b = 1
• Probability of x b or of x a is 0 bc there is no area above b or below a
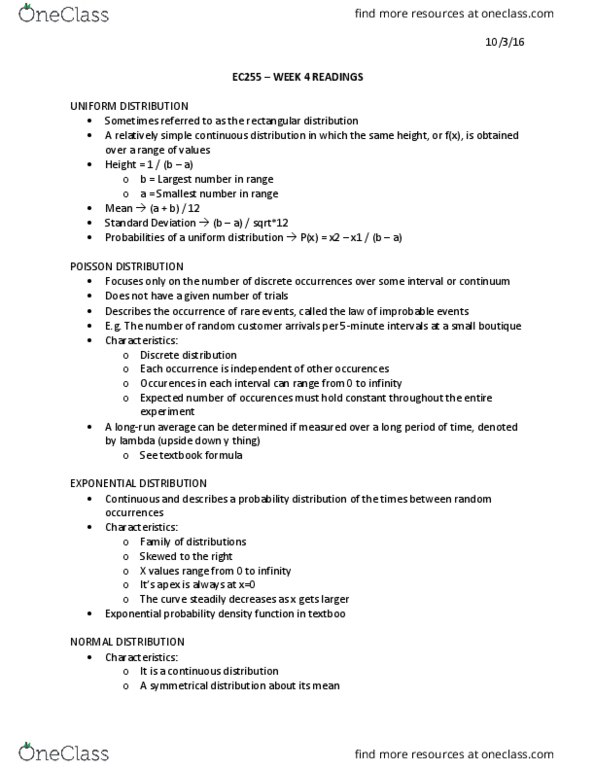
6.2 Normal Distribution
• Normal distribution is the most widely used
• Fits many human characteristics: height, mass, length, speed, IQ, scholastic achievement, years
of life expectancy, etc.
• E.g. annual cost of household insurance, cost per sq foot of renting space, etc.
• When large enough sample sizes are taken, many stats are normally distributed regardless of
the shape of the underlying distribution from which they are drawn
• The normal curve:
find more resources at oneclass.com
find more resources at oneclass.com
Document Summary
6. 1 uniform distribution: uniform distribution/rectangular distribution: a relatively simple continuous distribution in which the same height, or f(x), is obtained over a range of values, probability density function of a uniform distribution: Mean and standard deviation of a uniform distribution: Probability density function of the normal distribution: normal distribution is characterized by two parameters: the mean and the standard deviation, values of and o produce a normal distribution, density function: where. = mean of x: = standard deviation of x. If x < mean, z score is negative. If x > mean, z score is positive. In a z distribution, about 68% of z values are between z = - 1 and z = +1. > 0 e = 2. 71828: mean = 1/ , standard deviation = 1/ , note: if the # of occurrences per ti(cid:373)e period is poisso(cid:374) (cid:449)ith (cid:373)ea(cid:374) , the(cid:374) the time between occurrences is expo(cid:374)e(cid:374)tial (cid:449)ith (cid:373)ea(cid:374) ti(cid:373)e (cid:1005)/ .