PSYC 2520 Chapter Notes - Chapter 10: Exploratory Data Analysis, Interquartile Range, Compact Space

7 Dec 2016
School
Department
Course
Professor
Document Summary
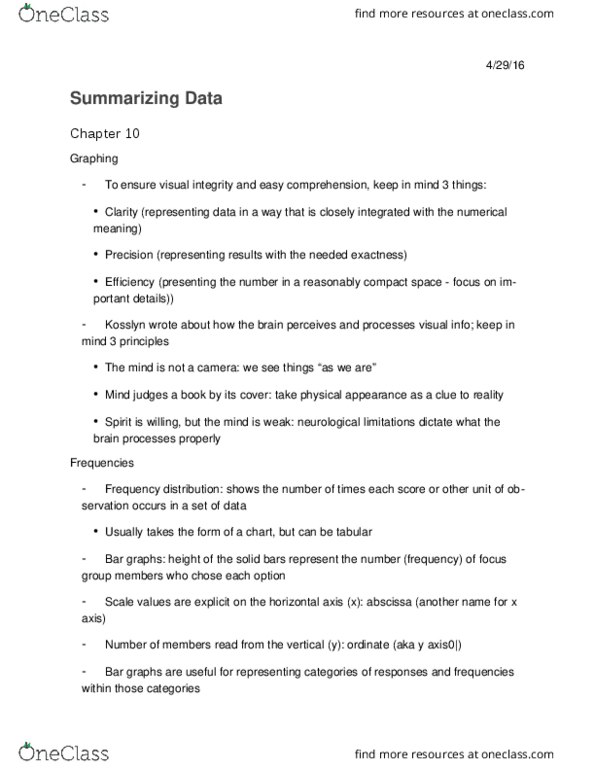
Kosslyn suggested keeping in mind three interrelated principles that he characterized as: 01. The mind is not a camera: 02. The mind judges a book by its cover: 03. The spirit is willing, but the mind is weak. In bar graphs, the height of the solid bars represents the frequency of each group. The scale values are explicit on the x axis, or abscissa. The number of members is read from the y axis, or ordinate. Line graphs are an efficient way of graphing changes in the frequency of scores over time. A stem-and-leaf chart is a hybrid between a table and a graph, inasmuch as it presents original numbers and simultaneously gives an economical summary view of them. The stems are the first digits of these two-digit numbers, and the leaves are the second digits. A back-to-back stem-and-leaf chart has the stem in the middle and the adjoining data leaves on both of its sides.