MATH 202 Chapter Notes - Chapter 15: Interquartile Range, Categorical Variable

Document Summary
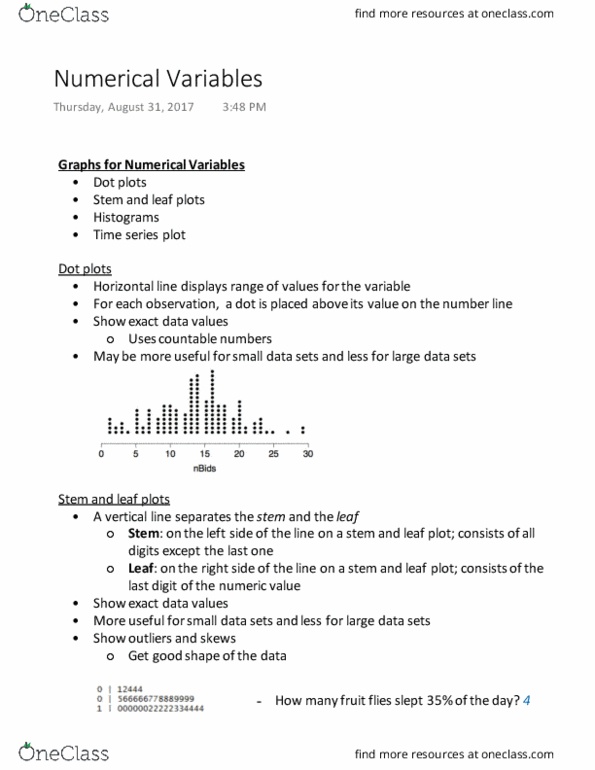
15. 1 formulating statistical questions, gathering data, and using samples. A statistical study begins by formulating a question that anticipates variability and that can be answered b collecting and analyzing data. In statistics, there are observational studies and experiments; both involve considering a populations. Common displays of categorical data include real graphs, pictographs, bar graphs, and pie graphs. Displays of numerical data include dot plots, histograms, stem and leaf plots, line graphs, and scatter plots. 15. 3 the center of data: mean, median and mode. The mean and median are good one-number summaries of a collection of numerical data. We can think of the mean in terms of leaving out the data. It provides a way of solving problems about the mean. Data can be distributed in different ways, so 2 sets of data with the same means and medians can be different.