STT 212 Chapter Notes - Chapter 4: Scatter Plot, Lincoln Near-Earth Asteroid Research, Rstudio

20 Feb 2017
School
Department
Course
Professor
Document Summary
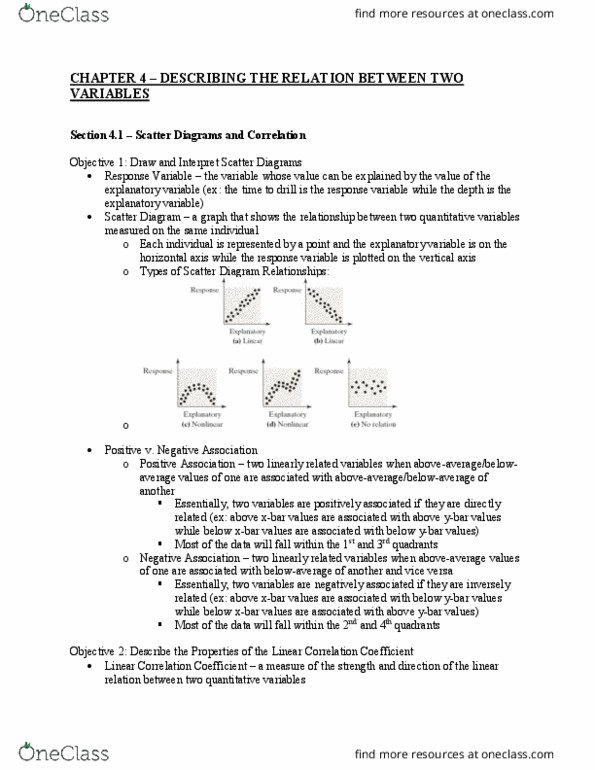
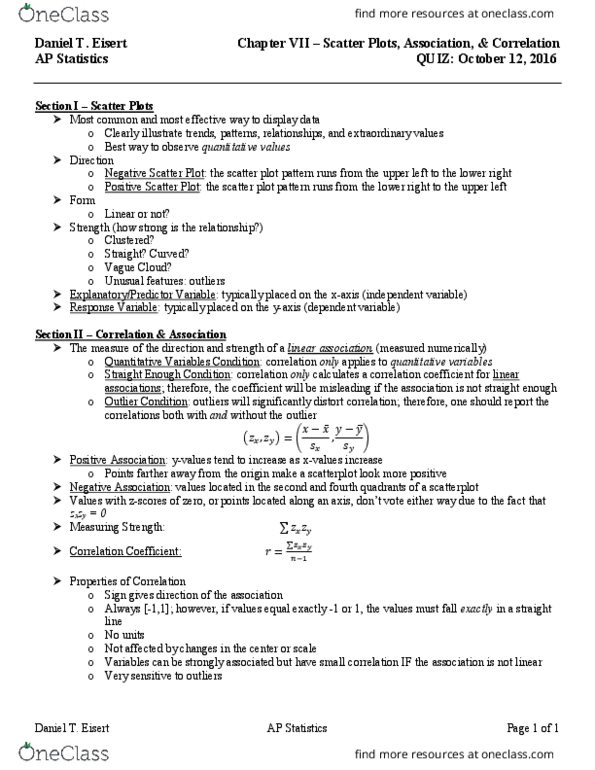
A scatterplot allows us to describe the linear relationship between two quantitative variables: you look for overall pattern. Strength (the less scatter, the greater the strength: be careful about outliers. Only an outlier if it is found outside of the linear path. Quadrants 1 and 3 are positive, quadrants 2 and 4 are negative. Note: quadrants are set by the xbar and ybar. Properties of the correlation coefficient: correlation does not depend on the units of measure of either variable, correlation does not depend on which variable is considered x or y, correlation rests between -1 and 1. Moderate r is . 5< r r >. 8. Strong r is . 8< r <1 or . 8>r>1: r = 0 means no linear relation. There could be a nonlinear relation: correlation does not imply causation, correlation is sensitive to extreme observations. Y1 - y = residual the distance between the observed y and the predicted y.