STA 309 Chapter Notes - Chapter 4: Scatter Plot, Homoscedasticity

Document Summary
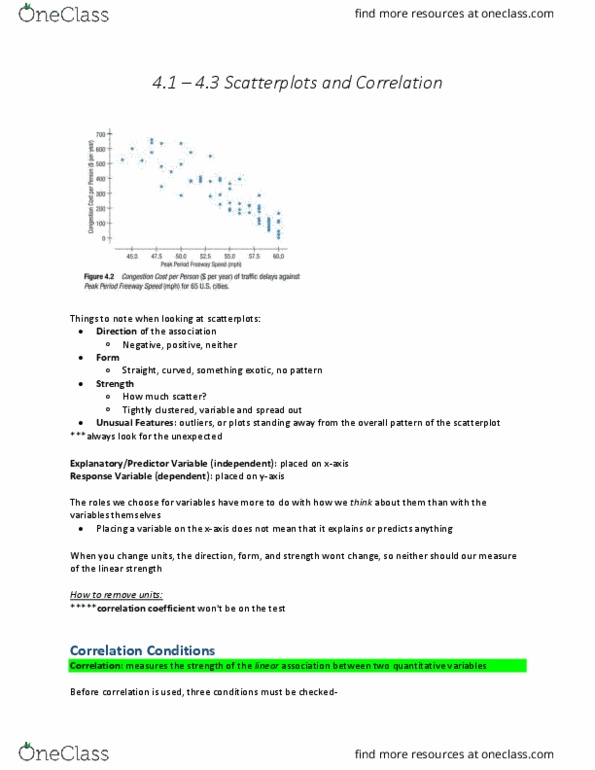
Scatterplot: plots one quantitative variable against another. Correlation coefficient: measures strength of association r = zxzy n - 1 r = (x - x )(y - ) r = (x - x )2 (y - )2 (n - 1) sxsy. Quantitative variables condition: correlation only applies to quantitative variables. Linearity condition: correlation only measures strength of linear association. Outlier condition: report correlation both with and without outliers. Sign of r: gives direction of association. Correlation is not affected by changes in scale. Lurking variable: a third variable that may affect both variables observed. Linear model: an equation of a straight line through the data. Predicted value: = b0 + b1x. Residual: difference between predicted value and observed value. Line of best fit (least squares line or regression lines): line for which sum of the squared residuals is smallest. Regression to the mean: predicted y tends to be closer to mean (in standard deviations) than corresponding x.