MATH 1060 Lecture 7: Z-Tables

MATH 1060 verified notes
7/11View all
Document Summary
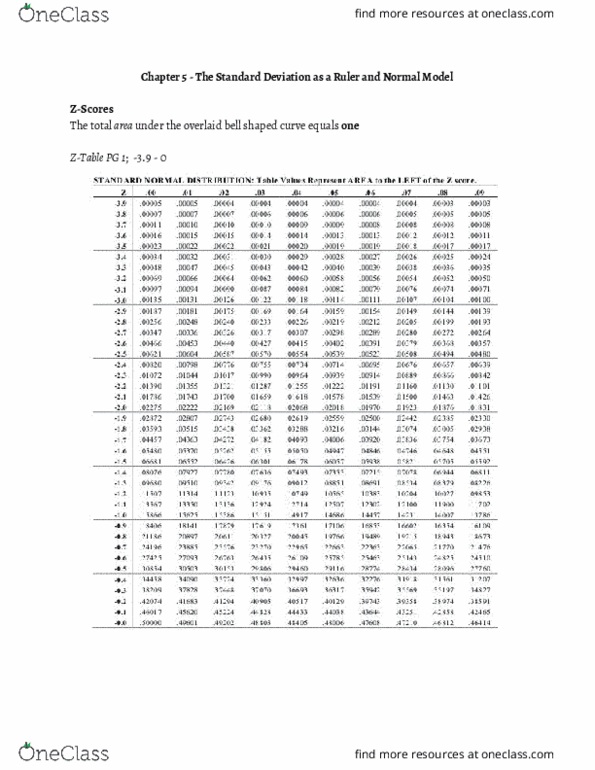
Chapter 5 - the standard deviation as a ruler and normal model. The total area under the overlaid bell shaped curve equals one. The smallest value in the z-table is -3. 9, anything lower than -3. 9 would be 0. The z-table gives the area to the left, if you are looking for the area to the right, you must subtract the area given from 1. Z itself cannot equal anything, because it is an interval. To find the percentage multiply answer by 100. Greater than or less than sign gives the direction. P(z x) = p(z -x): the negative value gives you the value to the right. Ex; the proportion of students with grades of 70 or less is the sum of the areas of the bars to the left of 70. This can be fairly closely approximated by the area under the curve to the left of 70. Answer: a grade of 77 corresponds to a z-score of ;