MGTS-312 Lecture Notes - Lecture 15: Microsoft Powerpoint, 2Degrees, Regression Analysis

21 May 2017
School
Department
Course
Professor
Document Summary
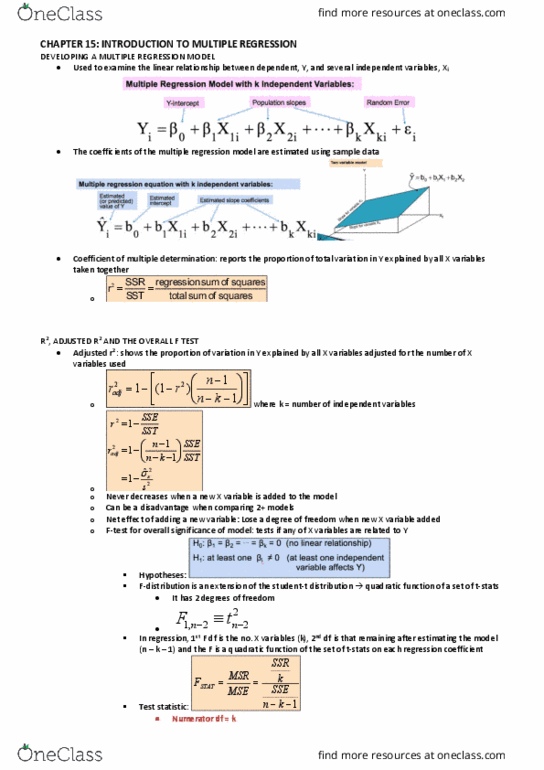
Recommendation: must complete the chapter-15 powerpoint slides including textbook readings before start the practice questions. All formulas are available in the powerpoint slides and in textbook with details explanation. An estimated regression equation relating sales to inventory investment and advertising expenditures has given as follows: The data used to develop the model came from a survey of 10 stores; for those data sst=16,000 and. 7: the adjusted coefficient of determination shows that 68% of the variability has been explained by the two independent variables; thus, we conclude that the model does not explain a large amount of variability. And, the we found the sst=25. 5 and ssr = 23. 435: compute the r-square and adjusted r-square, when television advertising was the only independent variable, rsq=. 653 and ad. rsq=. 595. Computing msr, mse, f and t test with given data. Lest example, we have an estimated regression equation based on 10 observation as follows: