ATOC 184 Lecture Notes - Lecture 5: Dew Point Depression, Dew Point, Supercell

14 Mar 2016
School
Department
Course
Professor
Document Summary
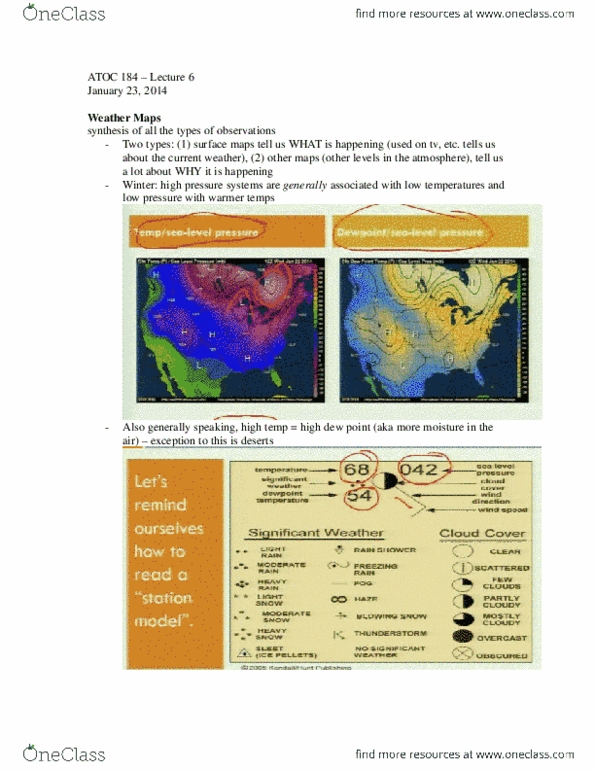
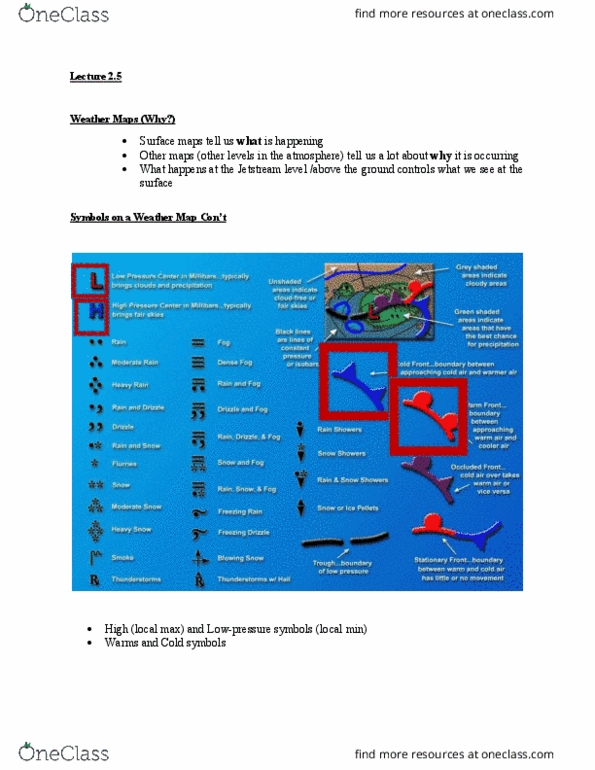
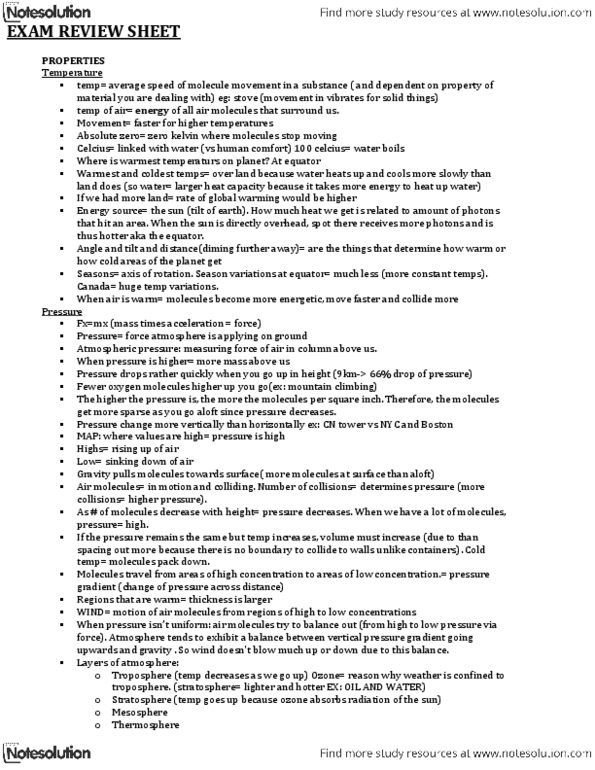
Pressure lines isobars lines of constant pressure. Blue line: cold air over taking warm air. Cold air is more dense so push warm air away. Surface maps tell us what is happening. Surface is controlled by whats above our heads. Other maps (other levels in the atmosphere) tell us a lot about why is occurring. E. g upper level maps; wheres the warm/ cold front. Warm fronts red with circular balls. Stationary fronts: boundary between warm and cold but no movement separation of. Dash line shift in wind that is not associated with temperature. Important in the sense that they give us an indication of both the direction and strength of the wind. Upper air maps plotting the same pressure but can be different height. Above the surface, pressure gradients are linked to changes in temperature. Thickness: the differences between two pressure surface. Only plot constant pressure when you are at the ground. Dew point is replaced by dew point depression.