HTHSCI 2S03 Lecture Notes - Lecture 1: Contingency Table, Sickle-Cell Disease, Collectively Exhaustive Events

26 May 2018
School
Department
Course
Professor

The Basics (Ch. 1)
1. Looking at the Data: A First look at Graphing Data (Ch. 2)
2S03: INTRODUCTION TO STATISTICS
Winter 2018 2S03, Session 1 12
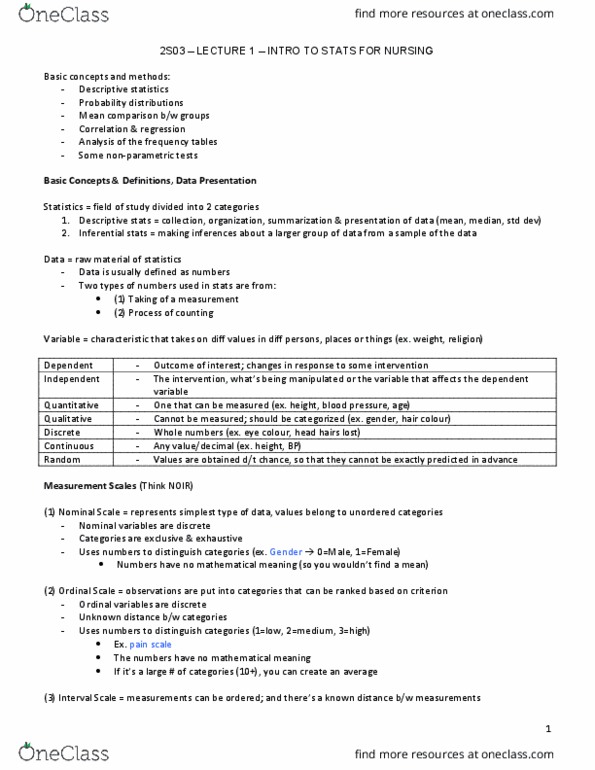
Basic Concepts and Definitions, Data Presentation
The Basics - Definitions
Statistics as a field of study is divided into 2 broad categories:
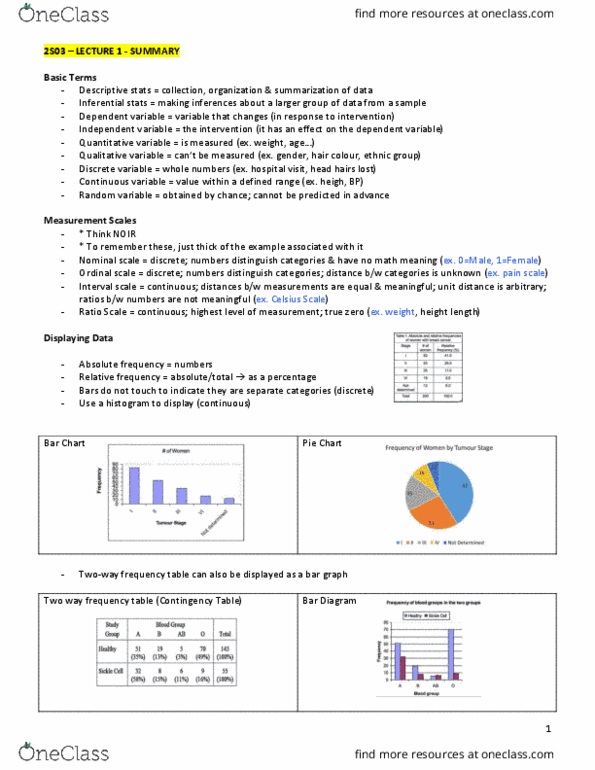
1. Descriptive Statistics: the collection, organization, summarization, and presentation of data- describe
the data (mean, median, mode), visual (pie chart, bar graph, etc)
2. Inferential Statistics: the drawing of inferences about a larger group of data from a sample of the
data- often working with a sample, not a population, therefore you must inference what the results
would be
Data
The raw material of statistics, usually defined as numbers
Two types of numbers that are used in statistics are from
1. Taking of a measurement- units
2. The process of counting- data that fall ito ategoies frequencies
Variables
a characteristic that takes on different values in different persons, places, or things; e.g. weight, religion
• dependent variable is the outcome of interest, which should change in response to some
intervention, would change in response to some other variable
• independent variable may be the intervention, what is being manipulated, or any variable that
may have an effect on the dependent variable.
• A quantitative variable can be measured, for example, height, blood pressure, weight, age
• A qualitative variable cannot be measured and should be categorized, for example, gender,
color of hair, ethnic group.
Discrete and Continuous variables (beta types)
• A discrete variable has values that can assume only whole numbers, examples: eye colour, head
hairs lost, hospital visits
• A continuous variable may take any value within a defined range; examples: height, weight,
blood pressure (think of anything that can have decimal point)
• Random variable: The values of a random variable are obtained as a result of some chance
factors, so that they cannot be exactly predicted in advance- not pre-determined, a’t
determine what the results will be
find more resources at oneclass.com
find more resources at oneclass.com

Lecture Question 1
Which of the following is an example of a discrete variable?
a) Weight (in g) of a newborn baby
b) Grip strength (in kg) of a 65 year old woman
A peso’s age i eas- typically measured in whole numbers while all other values are contiuous
d) Temperature in Hamilton
Measurement Scales – Discrete- NO
The Nominal Scale: represents the simplest type of data, in which the values fall into unordered
categories.
• Nominal variables are discrete
• Categories are mutually exclusive and collectively exhaustive.
• Ode of ategoize does’t atte
• Often use numbers to distinguish between categories, e.g., 0= Male, 1= Female.
• Numbers have no matheatial eaig so ou ould’t opute a aeage eause ou ae
simply acquiring counts)
Discrete: NO
Continuous: IR
Mutually exclusive: you can only fit into one category
Collectively exhaustive: all pieces of data have a category that they fit into
The Ordinal Scale: observations can be put into categories and can be ranked according to some
criterion, discrete information put into specifically ordered categories
• pai sale as =o pai…9=etee pai - Ordinal variables are discrete.
• Distance between categories is not known
• Again, often use numbers to distinguish between categories – e.g., 1= Low, 2= Medium, 3= High
• numbers have no mathematical meaning
• if large # of categories (10+), can create an average
• Categories have order to them 1- being lowest, 10-highest
• Intervals are not fixed 1-2 is not necessarily the same as 9-10
Measurement Scales – Continuous- IR
The Interval Scale: it is not only possible to order measurements, but also the distance between any two
measurements
• Interval variables are continuous
• Distances between measurements are equal.
• uit distae ad zeo ae aita, zeo is ot eessail a tue zeo ot total
absence of the item being measured, e.g., zero temperature).
• Differences between numbers meaningful, ratios between numbers are not
o Intervals are fixed- example: 2 degrees to 3 degrees is the same jump as 9 to 10 degrees
find more resources at oneclass.com
find more resources at oneclass.com
Document Summary
1: looking at the data: a first look at graphing data (ch. The raw material of statistics, usually defined as numbers. Two types of numbers that are used in statistics are from: taking of a measurement- units, the process of counting- data that fall i(cid:374)to (cid:272)atego(cid:396)ies (cid:862)frequencies(cid:863) Mutually exclusive: you can only fit into one category. Collectively exhaustive: all pieces of data have a category that they fit into. Intervals are not fixed 1-2 is not necessarily the same as 9-10 if large # of categories (10+), can create an average. The interval scale: it is not only possible to order measurements, but also the distance between any two measurements. Intervals are fixed- example: 2 degrees to 3 degrees is the same jump as 9 to 10 degrees: 0 is arbitrary- 0 temperature does not mean 0 energy. The ratio scale: highest level of measurement, intervals and ratios between numbers are meaningful.