PNB 3RM3 Lecture Notes - Lecture 40: Likert Scale, Box Plot, Laziness

7 Oct 2020
School
Department
Course
Professor
Document Summary
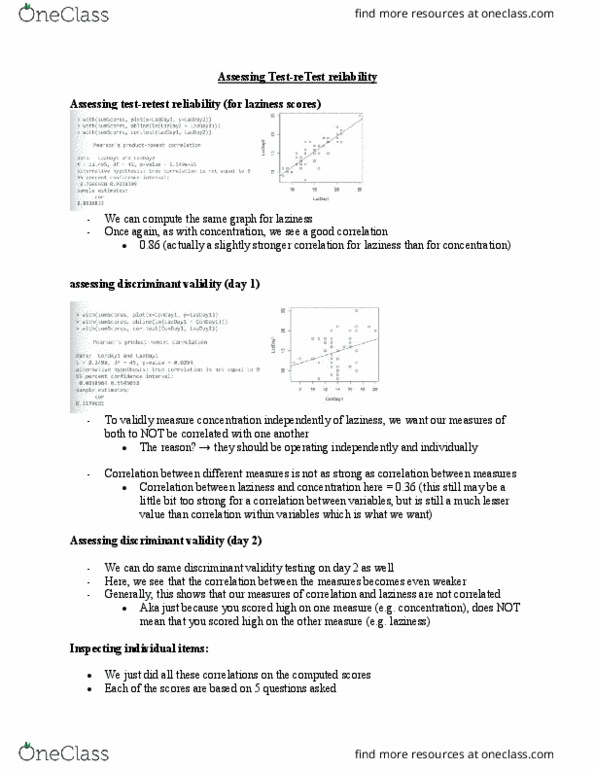
Examples of one tailed and two tailed tests. Slides go through the operationalization of laziness and concentration. Also, specifies the details of the likert scale being used for the self-report measure. Plotting raw data: using the above commands, you are able to plot a graph of the raw data sets for both test trials. Sumscores" = inputting data into r software so it can be used to plot the graph. Individual participant scores are added on to the boxplot on the right. Equation of correlation matrix is the first line which outputs the table. Have a diagonal of the same scores (1. 000) Pearson: easy to change correlation if u change datasets. If table is converted to a visual to better represent the data, then that would be the figure on the right (correlation plot) Blueness and size of the circle reflect how strong the correlation is between the variasbles indicated on the left and the variables on the top.