SOCSCI 2J03 Lecture Notes - Lecture 6: Frequency Distribution, Histogram

25 Jan 2019
School
Department
Course
Professor
SOCSCI 2J03 verified notes
6/27View all
Document Summary
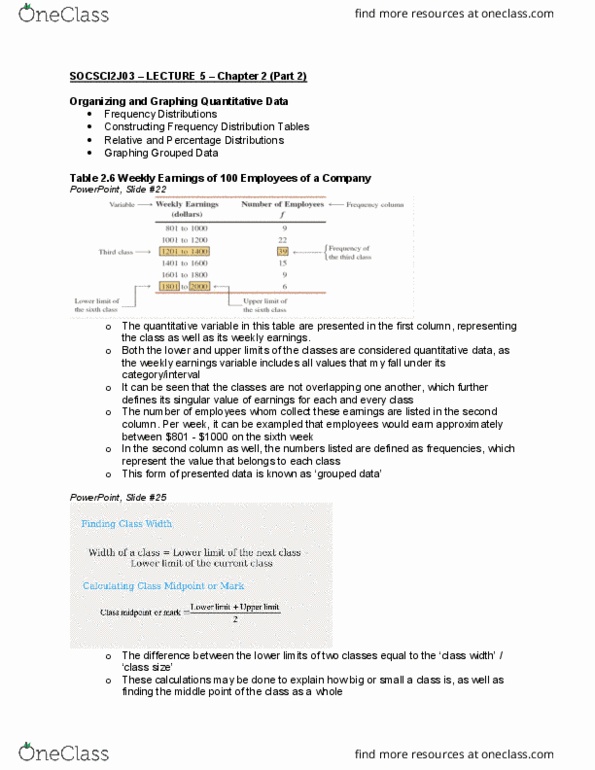
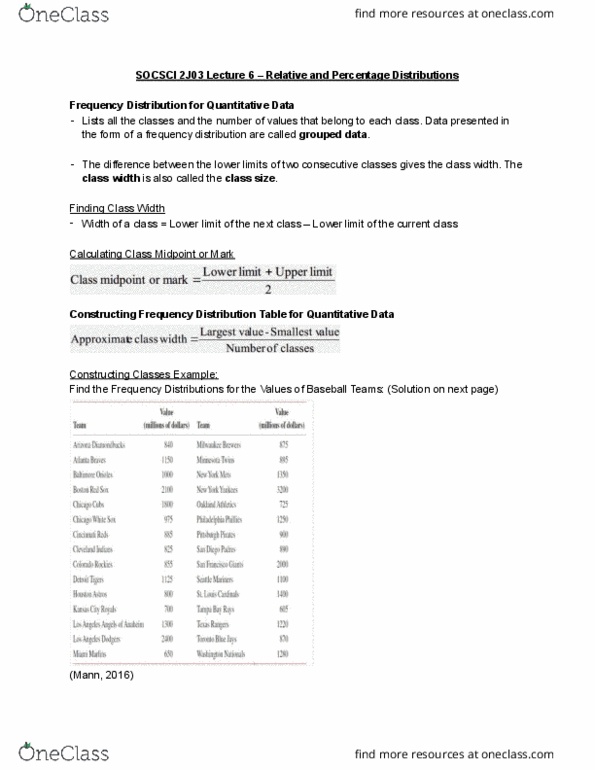
Socsci 2j03 lecture 6 relative and percentage distributions. Lists all the classes and the number of values that belong to each class. Data presented in the form of a frequency distribution are called grouped data. The difference between the lower limits of two consecutive classes gives the class width. The class width is also called the class size. Width of a class = lower limit of the next class lower limit of the current class. Find the frequency distributions for the values of baseball teams: (solution on next page) (mann, 2016) Minimum value is 605, and the maximum value is 3200. Find difference between these values (-) and divide by number of classes. Group these data using six classes of equal width: now, we round this approximate width to a convenient number, say 435, or 450. The lower limit of the first class can be taken as 605 (the minimum value) or any number less than 605.