QMS 102 Lecture Notes - Lecture 4: Covariance, Data Analysis, Squared Deviations From The Mean

30 Jan 2017
School
Department
Course
Professor
Document Summary
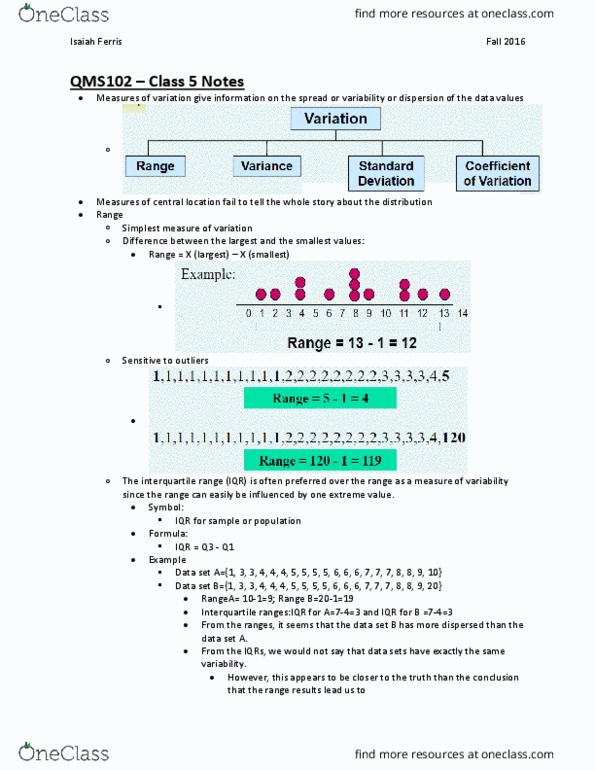
Week 4 statistics lecture weighted mean, mean for grouped data and data variability. Weighted mean formula x = sum wx/sum w x= data w= weight. Average of squared deviations of values from the mean. Compute the difference between each value and the mean. Divide this total by n-1 to get the sample variance. Take the square foot of the sample variance to get the sample standard deviation. The more the data are spread out, the greater the range, variance, and standard deviation. The more the data are concentrated, the smaller the range, variance and standard deviation. If all values are the same (no variation), all these measures will be zero and not negative ever. Can be used to compare the variability of two or more sets of data measured in diffent units. Skewness measure the amount of asymmetry in a distribution. Left-skewed = mean < median symmetric mean = median right skewed = mean.