QMS 102 Chapter Notes - Chapter 3: Squared Deviations From The Mean, Standard Deviation, Central Tendency

21 Feb 2016
School
Department
Course
Professor
Document Summary
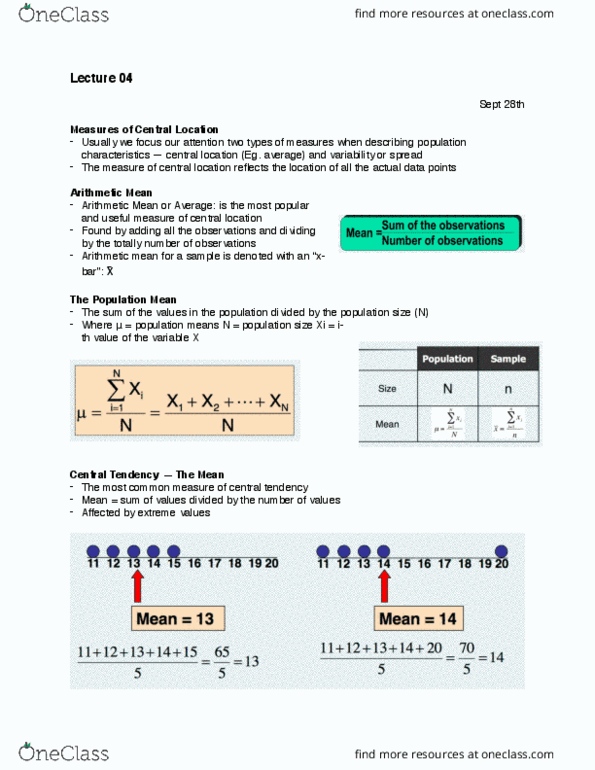
The central tendency is the extent to which all the data values group around a typical or central value. The variation is the amount of dispersion or scattering of values. The shape is the pattern of the distribution of values from the lowest value to the highest value. The most common measure of central tendency. Mean = sum of values divided by the number of values. In an ordered array, the median is the middle number (50% above, 50% below) The locaion of the median when the values are in numerical order (smallest to largest): If the number of values is odd, the median is the middle number. If the number of values is even, the median is the average of the two middle numbers. Note that n+1/2 is not the value of the median, only the posiion of the median in the ranked data. Used for either numerical or categorical (nominal) data.