BUEC 232 Lecture Notes - Lecture 3: Histogram, Ogive, Bar Chart

19 Jun 2015
School
Department
Course
Professor


16
BUEC 232 Full Course Notes
Verified Note
16 documents
Document Summary
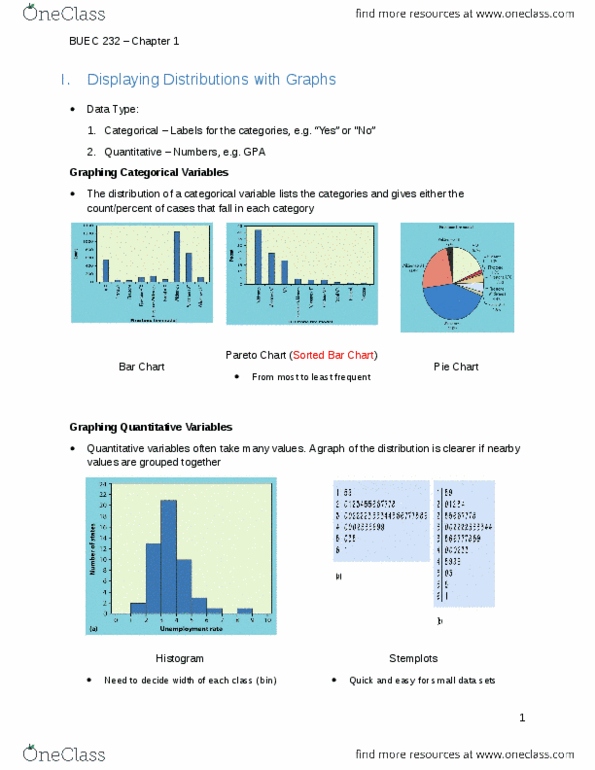
Summary table is used to summarize variable categorical data. Contingency table helps organize two or more categorical variables: used to study patterns that may exist between the responses of two or more categorical variables, cross tabulates or tallies jointly the responses of the categorical variables. For two variables the tallies for one variable are located in the rows and the tallies for the second variable are located in the columns. Bar and pie charts: bar charts and pie charts are often used for qualitative data (categories or nominal scale, height of bar or size of pie slice shows the frequency or percentage for each category. A sequence of data in rank order: shows range (min to max, provides some signals about variability within the range, may help identify outliers (unusual observations) If the data set is large, the ordered array is less useful. A simple pencil and paper technique to sketch distribution of a data set.