HSCI 330 Lecture Notes - Lecture 11: Confidence Interval, Sampling Distribution, Relative Risk

8 Apr 2020
School
Department
Course
Professor
Document Summary
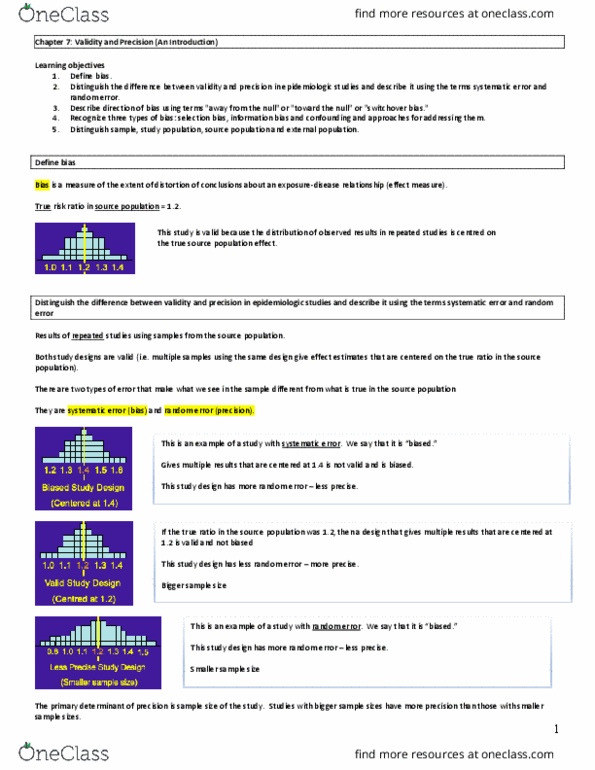
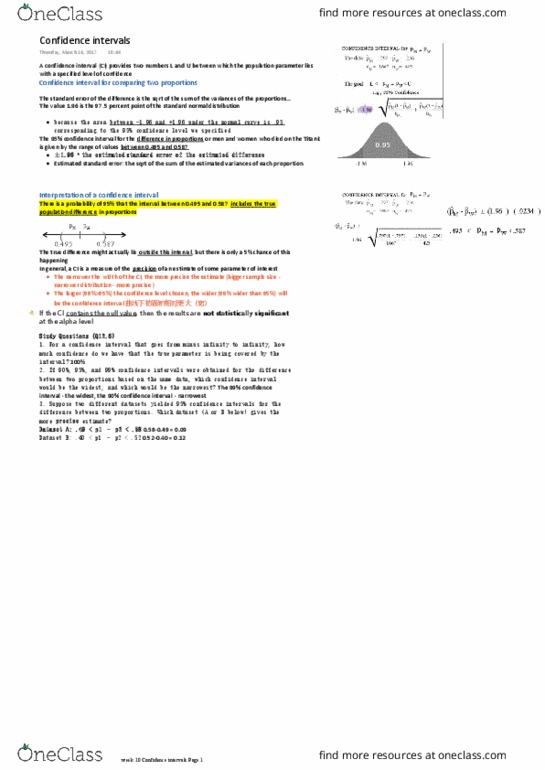
Learning objectives: given a realistic table of results, students will be able to interpret a confidence interval in words. Students will be able to contrast (in words) the difference in the interpretation of a p value and a confidence interval. Students will be able to predict changes in the width of a confidence interval based upon prescribed changes in alpha level. Students will be able to describe (in words) the connection between the width of a confidence interval and the amount of precision in a study. A larger sample size gives a thinner distribution. A bigger sample size in this example is only making a more precise estimate of the biased rr in the study population. This is the sampling distribution for a risk difference. This shows a sampling distribution with the colours for 2-sided =0. 05. (notice that the coloured area equals 5% total and the middle area therefore equals 95% (because the entire area under the curve equals.