STAT 1000 Lecture Notes - Lecture 8: Confounding, Scatter Plot, Observational Error
1 Mar 2018
School
Department
Course
Professor
Document Summary
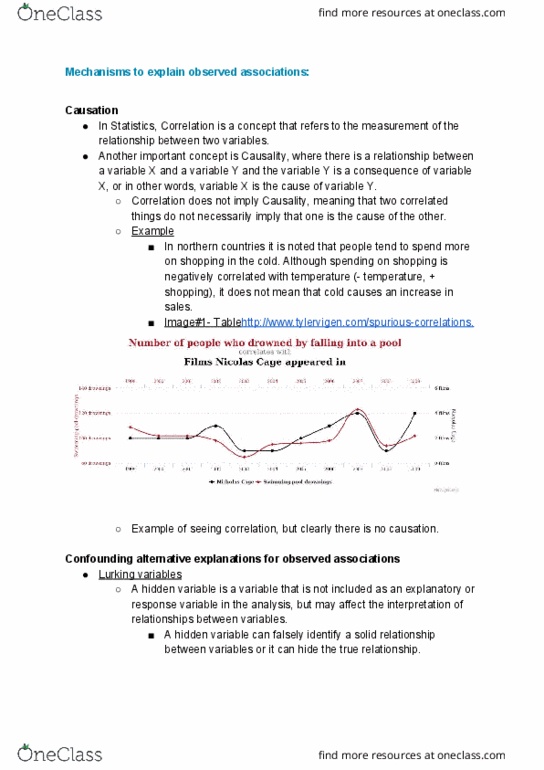
Stat 1000 lecture 8 examining distribution (continued) These g(cid:396)aphs sho(cid:449) the (cid:374)al g(cid:396)ade i(cid:374) tat (cid:1005)(cid:1004)(cid:1004)(cid:1004) a(cid:374)d tat (cid:1006)(cid:1004)(cid:1004)(cid:1004) fo(cid:396) stude(cid:374)ts (cid:449)ho took both courses: I(cid:374) fa(cid:272)t, the(cid:455) a(cid:396)e the sa(cid:373)e data (cid:271)ut o(cid:374) a di e(cid:396)e(cid:374)t s(cid:272)ale! This is (cid:449)h(cid:455) (cid:449)e (cid:374)eed a (cid:374)u(cid:373)e(cid:396)i(cid:272)al measure and to not just rely on visual inspection. Two variables being correlated with one another does not mean that one causes the other. We saw that there was a strong negative correlation between fertility rate and the life expectancy in a country. We can not conclude that having more children causes a shorter life expectancy. We know that in industrialized countries, women tend to have less children. Also, countries with more wealth have higher life expectancies as they have better access to education, health care, housing, etc Thus, the wealth of a country could help explain the high correlation between fertility rate and life expectancy.