PSYC 101 Lecture 3: PSYC 101 Lecture 3

12 Jan 2019
School
Department
Course
Professor

PSYC 101 verified notes
3/3View all
Document Summary
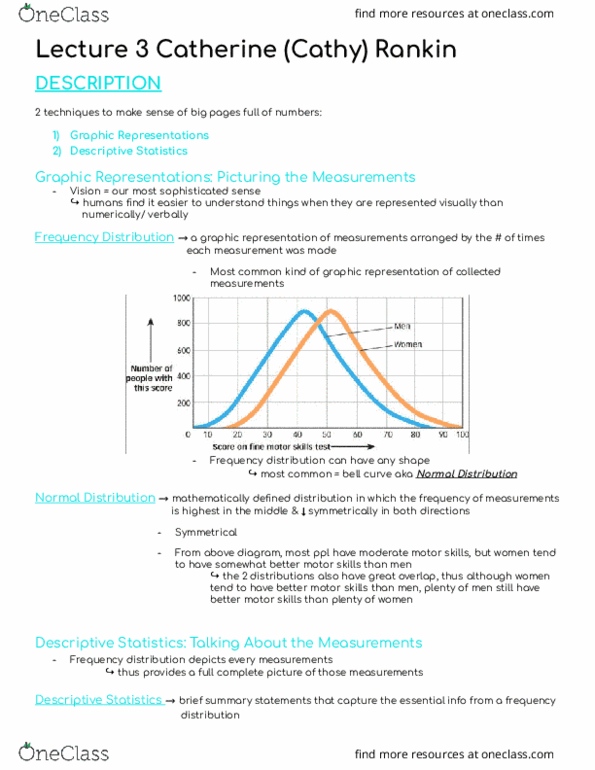
2 techniques to make sense of big pages full of numbers: graphic representations, descriptive statistics. Humans nd it easier to understand things when they are represented visually than mi numerically/ verbally. Frequency distribution a graphic representation of measurements arranged by the # of times each measurement was made. Most common kind of graphic representation of collected measurements. Most common = bell curve aka normal distribution. Normal distribution mathematically de ned distribution in which the frequency of measurements is highest in the middle & symmetrically in both directions. From above diagram, most ppl have moderate motor skills, but women tend to have somewhat better motor skills than men. The 2 distributions also have great overlap, thus although women tend to have better motor skills than men, plenty of men still have better motor skills than plenty of women. Thus provides a full complete picture of those measurements. Descriptive statistics brief summary statements that capture the essential info from a frequency distribution.