STAB22H3 Lecture Notes - Lecture 3: Decimal Mark, Histogram, Central Tendency

STAB22H3 verified notes
3/4View all


Document Summary
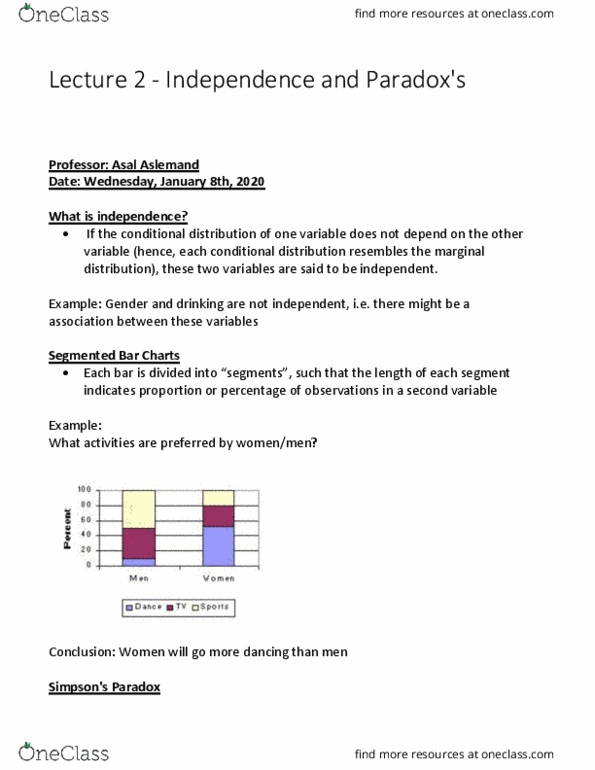
There are three main graphical methods for describing, summarizing, and detecting patterns in quantitative data: A stemplot gives a quick picture of the shape of a distribution while including the actual numerical values in the graph. Separate each observation into a stem consisting of all but the final (rightmost) digit and a leaf, the final digit. Write the stems in a vertical column with the smallest at the top, and draw a vertical line at the right of this column. Write each leaf in the row to the right of its stem, in increasing order out from the stem. Decimal point is 1 digit(s) to the right of the colon. It places a dot along an axis for each case in the data. It is very like a stemplot but with dots instead of digits for all the leaves. They are quite useful for small data sets. Here is a dotplot of ages for a group of people: