Biology 2581B Lecture 16: Lecture 16 - Quantitating Gene Regulation

3 Jun 2014
School
Department
Course
Professor
Document Summary
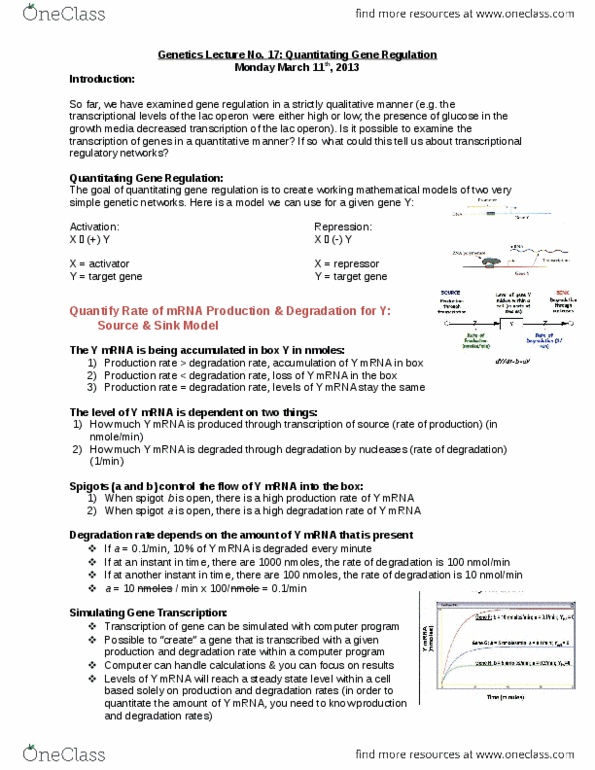
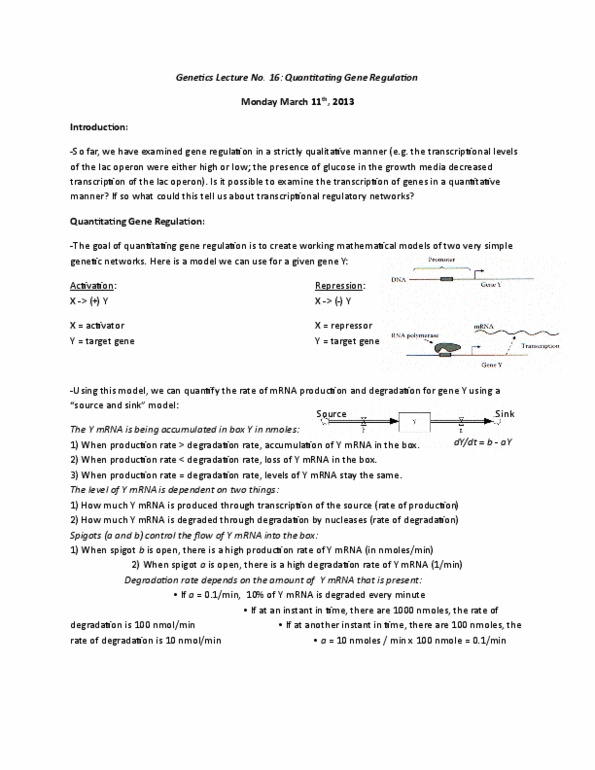
X = transcriptional activator, y = target gene: model of repression (x y) X = transcriptional repressor, y = target gene. Box represents level of the message that is present within the cell. If a = 0. 1/min 10% of y gets degraded every minute. The levels of y mrna will reach a steady state level within a cell based solely on production and degradation rates. The initial levels of y mrna will not affect the final steady state levels of the message. X* = crp-camp complex: rate of production (y promoter activity) is a function of x* Simple graph, y promoter activity is plot on and x* on the x axis. X* = co-repressor-repressor complex: repression: y promoter is proportional to 1/x. Approximation) how order steady little strong response maximal value) Describing act ivat ion mat hemat ically: the y axis. Hill funct ion f or an act ivat or. An example of the utility of a simulation.