Physiology 3120 Lecture Notes - Lecture 4: Aortic Valve, Heart Valve, Atrioventricular Node

1 Feb 2016
School
Department
Course
Professor
Document Summary
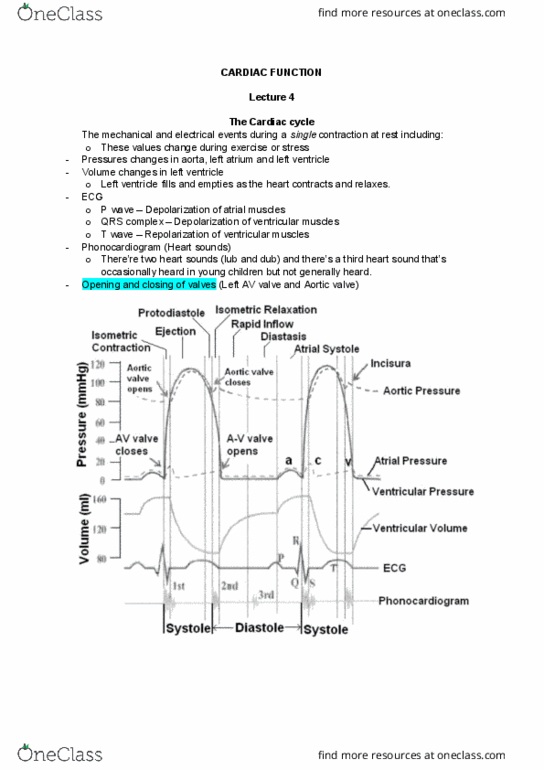
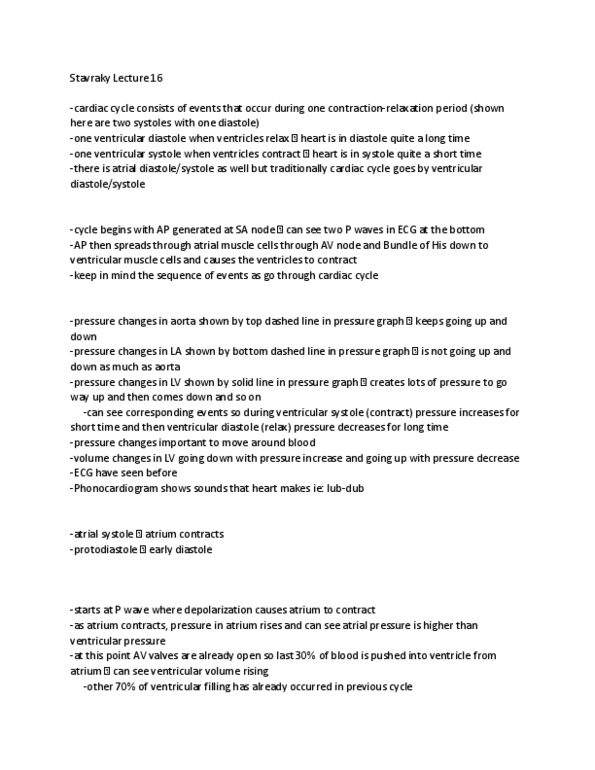
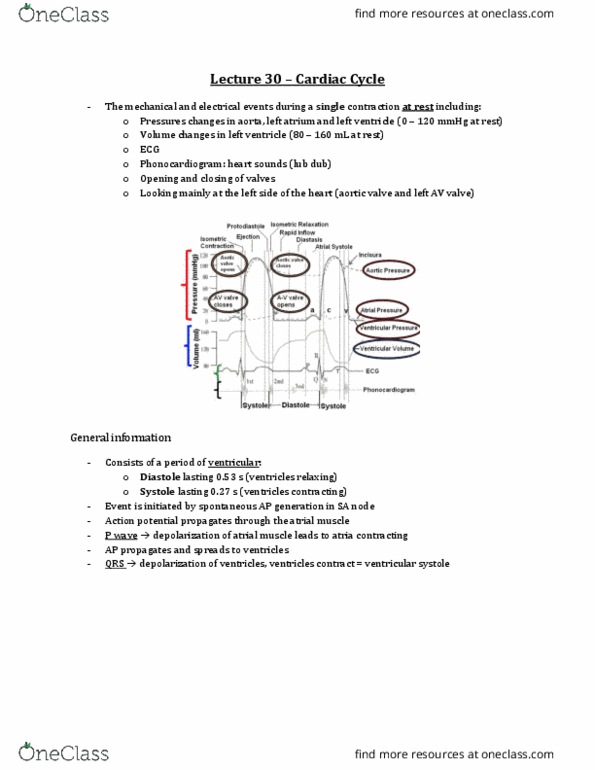
The cardiac cycle diagram shows all the pressure and volume changes (mechanical events) and electrical events during a single contraction. Pressure changes in aorta, left atria and left ventricle. Rapid (ejection) period: when blood is ejected from the heart. Protodiastole: before true relaxation occurs, the beginning of the relaxation. Rapid inflow: when blood is rapidly flowing into the ventricles. Each cardiac cycle is initiated by the spontaneous generation of an action potential in the pacemaker of the heart, the sa node. The impulse spreads rapidly throughout the atria and is conducted into the av node and then into the ventricles. 2. pressure changes in various parts of the heart -> it"s these pressure changes which then lead to the opening and closing of valves as the blood moves through the heart. In most cases (except one) this indicates that valves are opening or closing. Blood flows from areas of high pressure to low pressure.