Statistical Sciences 1024A/B Lecture Notes - Lecture 7: Scatter Plot, Dependent And Independent Variables

27 Sep 2018
School
Department
Professor
Document Summary
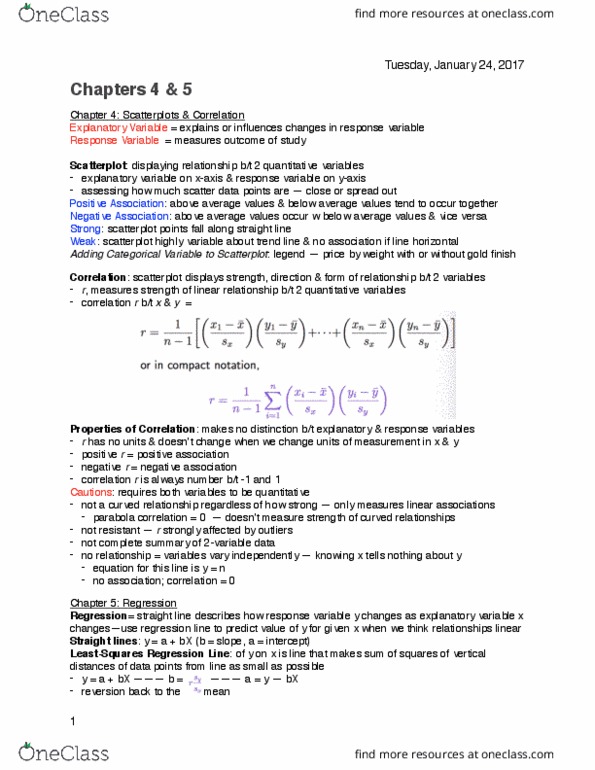
Response variable: measures an outcome of a study. Explanatory variable: explains or in uences changes in a response variable. Usually, we designate a response variable using y and an explanatory using x. We are interested in how changing x effects y > the relationship. Scatterplot: shows the relationship between 2 quantitative variables measured on the same individuals. The values of 1 variable appear on the vertical axis and the values of the other variable appear on the horizontal axis. Scatterplots are used to visualize the relationship of y to x (response to explanatory) See if 1 variable can explain the behaviour of the other variable. Look for the overall pattern and for deviations from the pattern. Describe the overall pattern of the scatterplot by the direction, form and strength of the relationship. Increase in x leads to increase in y (positive direction) Increase in x leads to decrease in y (negative direction)