Statistical Sciences 1024A/B Study Guide - Midterm Guide: Confounding, Interpolation, Scatter Plot

9 Jul 2014
School
Department
Professor
Document Summary
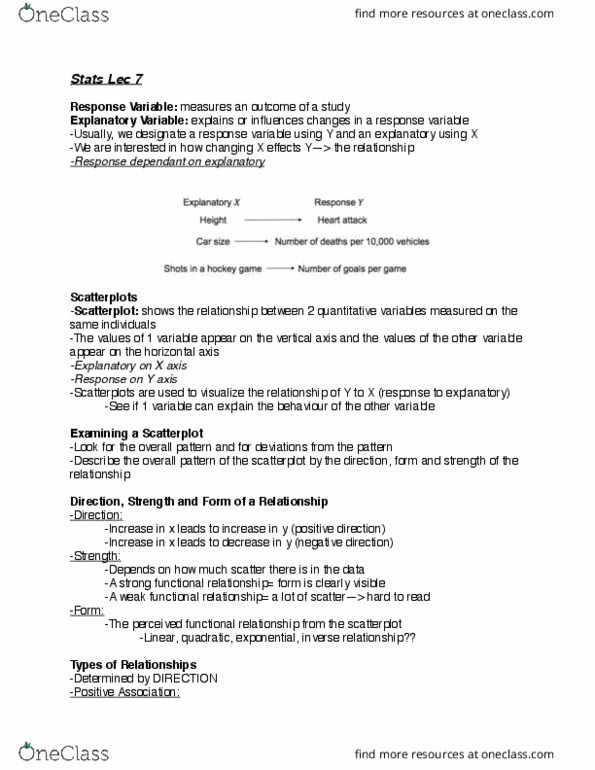
To study relationships between variables, we must measure the variables on the same group of individuals. If we think that a variable x may explain or even cause changes in another variable y, we call x an explanatory variable and y a response variable. A scatterplot displays the relationship between two quantitative variables measures on the same individuals. Mark values of one variable on the x axis, and the other variable on the y axis. Plot each individual"s data as a point on the graph. Always plot the explanatory variable, if there is one, on the x axis. Plot points with diff colors or symbols to see if the effect of a categorical variable in a scatterplot. In examining a scatterplot, look for an overall pattern showing the direction, form, and strength of the relationship and then for outliers or other deviations from this pattern.