Statistical Sciences 1024A/B Lecture Notes - Lecture 3: Standard Score, Standard Deviation, Normal Distribution

5 Oct 2018
School
Department
Professor
Document Summary
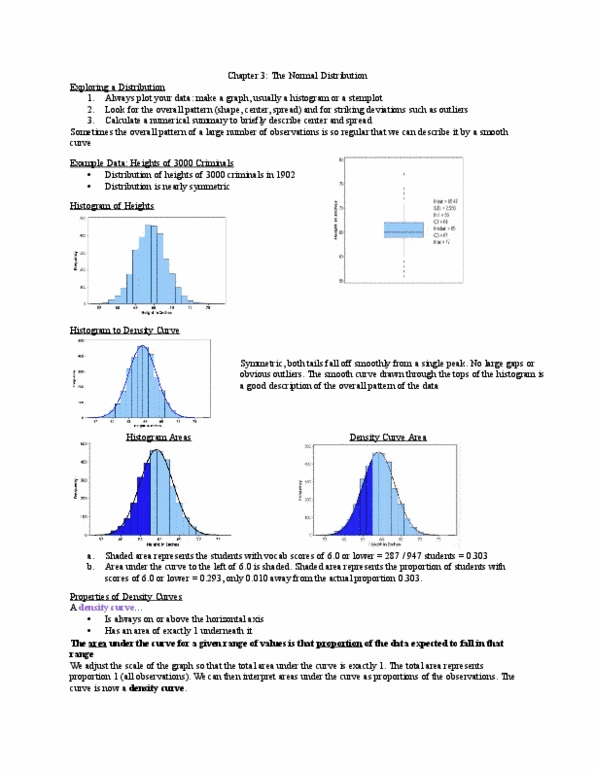
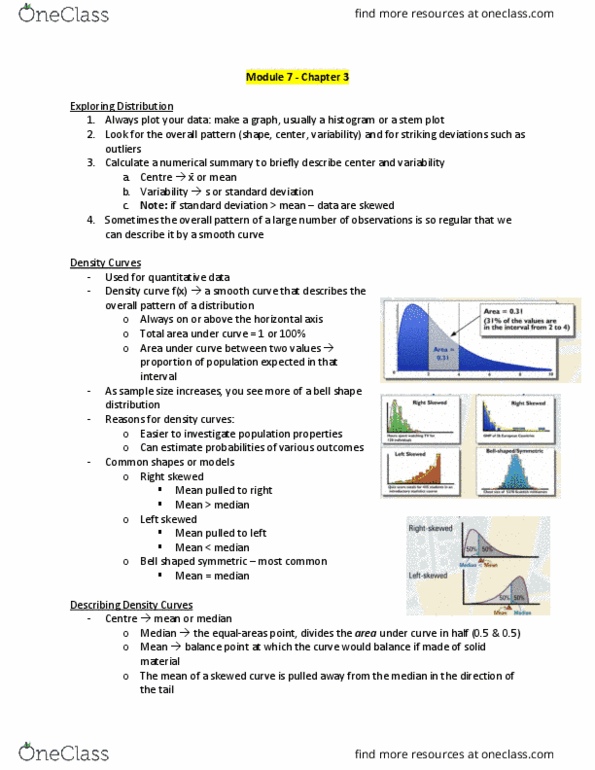
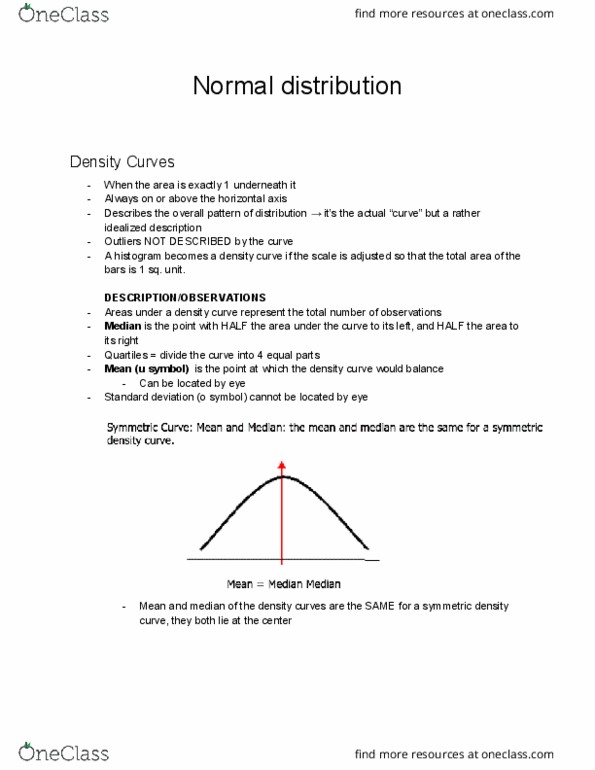
This proportion is equal to 0. 303: now the area under the smooth curve to the left of 6. 0 is shaded. If the scale is adjusted so that the total area under the curve is exactly 1, then this curve is called a density curve. The proportion of the area to the left of 6. 0 is now equal to 0. 293. Density curves: a density curve is a curve that: is always on or above the horizontal axis, has an area of exactly 1 underneath it, a density curve describes the overall pattern of a distribution. The description is in terms of a mathematical function: for the theory to coincide with the observations, the histogram and the density curve should be similar. The mean as the centre of gravity of the density curve. Normal distributions: one particularly important class of density curves are the normal curves, which describe.