Statistical Sciences 1024A/B Lecture Notes - Lecture 3: Medes, Standard Score, Random Variable

20 Apr 2016
School
Department
Professor
Document Summary
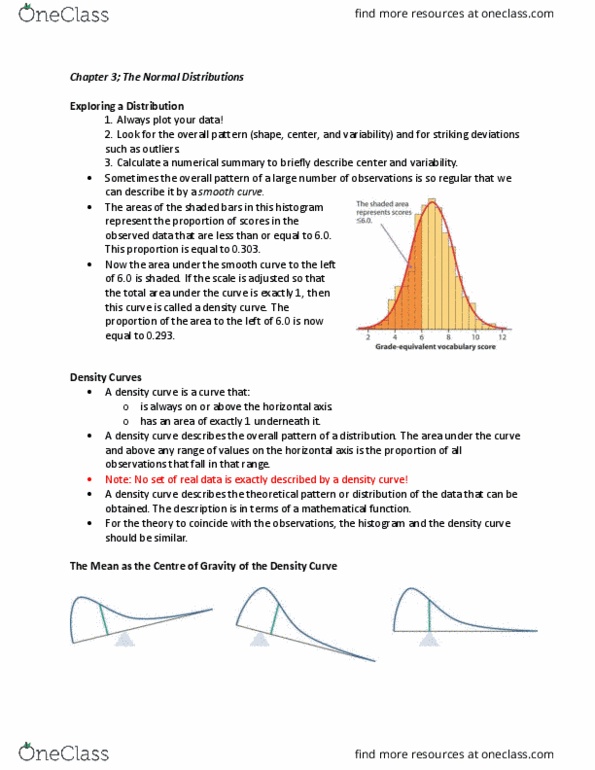
Sometimes the overall pattern of a large number of observations is so regular that we can describe it by a smooth curve. Distribution of heights of 3000 criminals in 1902. Symmetric, both tails fall off smoothly from a single peak. The smooth curve drawn through the tops of the histogram is a good description of the overall pattern of the data. Histogram areas density curve area: shaded area represents the students with vocab scores of 6. 0 or lower = 287 / 947 students = 0. 303, area under the curve to the left of 6. 0 is shaded. Shaded area represents the proportion of students with scores of 6. 0 or lower = 0. 293, only 0. 010 away from the actual proportion 0. 303. Is always on or above the horizontal axis. Has an area of exactly 1 underneath it. The area under the curve for a given range of values is that proportion of the data expected to fall in that range.