Statistical Sciences 2035 Lecture Notes - Lecture 2: Unimodality, Statistical Hypothesis Testing, Long Tail

6 Oct 2017
School
Department
Professor
Document Summary
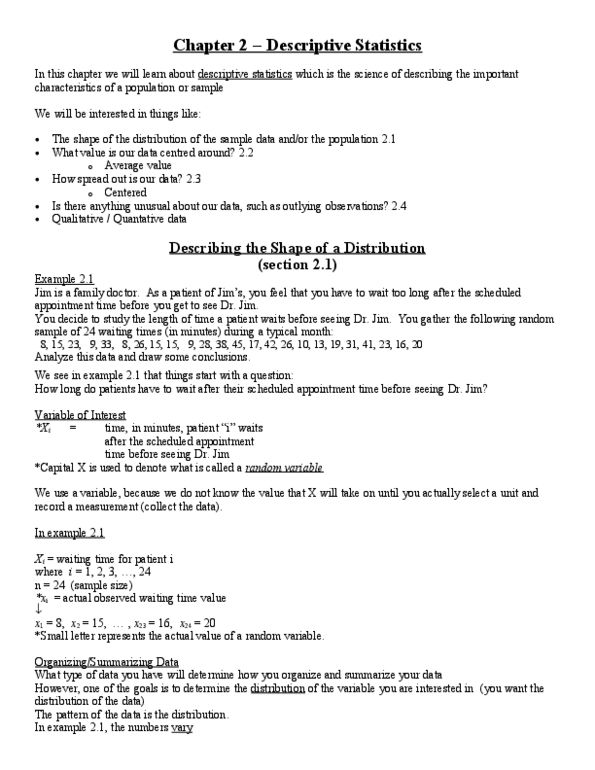
In this chapter, we will learn about several techniques for summarizing and depicting data. Frequency distributions/graphical displays for quantitative data (section 2. 1/2. 2) A fast food restaurant has a drive-through lane. The restaurant (call them fast food chain #1) is interested in how many cars go through the drive-through lane during the lunch hour (11:45 to 1:15 pm). The fast food chain gathers the following data on the number of cars passing through the drive-through lane during the lunch hour over the past 39 days: We see in example 2. 1 that things start with a question: Variable of interest (the general convention is to use a capital letter to capture a random variable) What type of data you have will determine how you organize and summarize your data (categorical/measurement) However, one of the goals is to determine the distribution of the variable you are interested in (you want the distribution of the data)