ECON 2500 Lecture Notes - Lecture 15: Pareto Chart, Statistical Process Control, Standard Deviation

28 Apr 2017
School
Department
Course
Professor


14
ECON 2500 Full Course Notes
Verified Note
14 documents
Document Summary
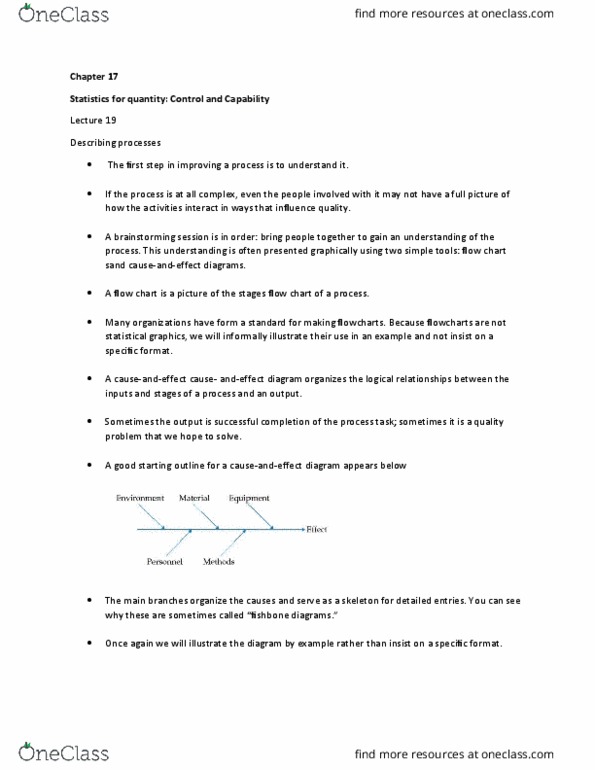
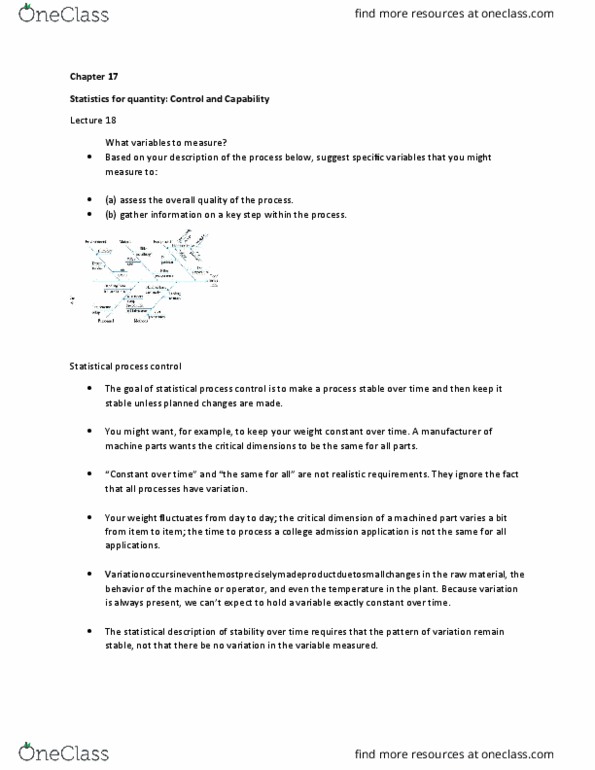
Lecture 15: work is organized in processes, chains of activities that lead to some result. We use o(cid:449)(cid:272)ha(cid:396)ts a(cid:374)d (cid:272)ause-and-effect diagrams to describe processes. If the pattern of variation is stable over time, the process is in statistical control. The control limits lie three standard deviations of q above and below the center line: a point outside the control limits is an out-of control signal. The s chart monitors variation within individual samples. If the s chart is in control, the x chart monitor variation from sample to sample. To interpret the (cid:272)ha(cid:396)ts, al(cid:449)a(cid:455)s look (cid:396)st at the s (cid:272)ha(cid:396)t. Determining sources of common and special cause variation: refer to the previous exercise. The time at which you reach work or class varies from day to day, and your planning must allow for this variation. List several common causes of variation in your arrival time.