STAT 8010 Lecture Notes - Lecture 2: Central Angle, Bar Chart, Univariate

20 Aug 2016
School
Department
Course
Professor
Document Summary
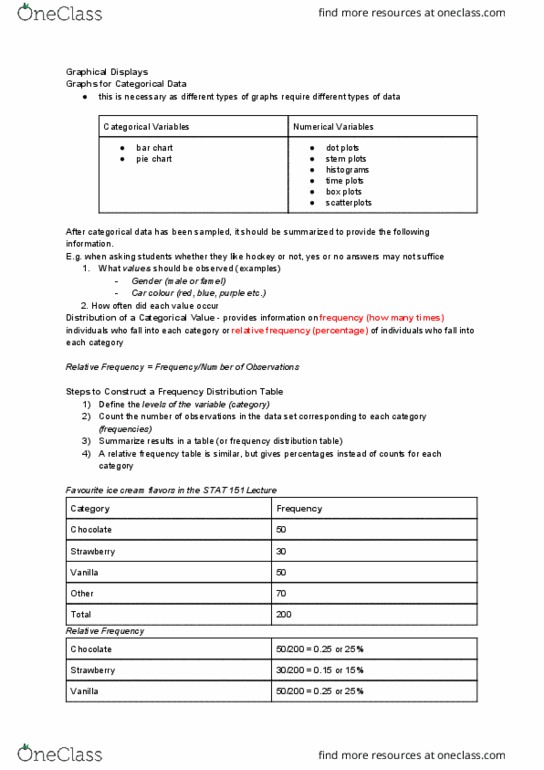
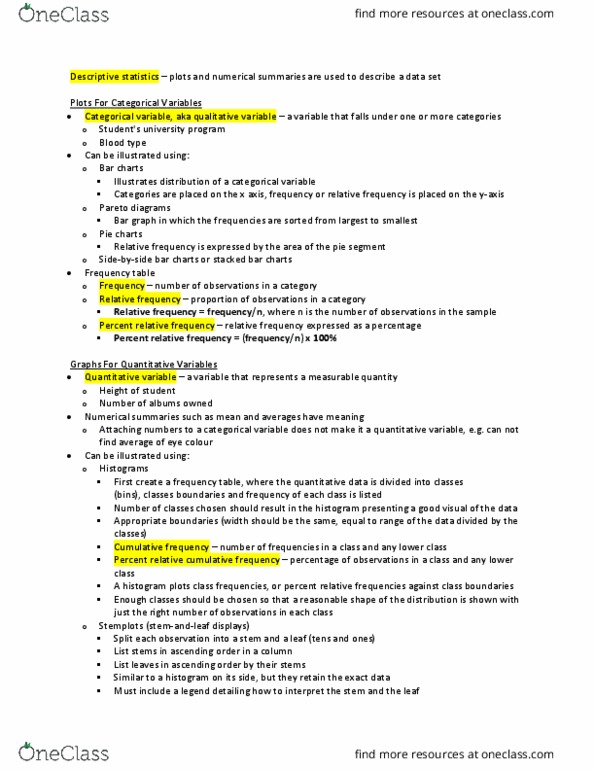
Chapter 3 lecture notes from 08/19/2016, stat 8010. In statistics, a variable may change from one individual to the next. Variable: any characteristic of interest in a statistical analysis. Qualitative variable: a characteristic which does not have numeric meaning. Quantitative variable: a characteristic which does have numeric meaning. Frequency distribution: a table that matches category names with the number of observations in that category. Relative frequency distribution: a table that matches category names with the relative frequencies of observations in each category. Bar graphs: there is a bar for each category. The height of the bar indicates the frequency or relative frequency of observations in each category. The horizontal axis is labeled with the categories and the vertical axis is labeled with either frequencies or relative frequencies. Pie chart: the central angle is equal to the relative frequency multiplied by 360.