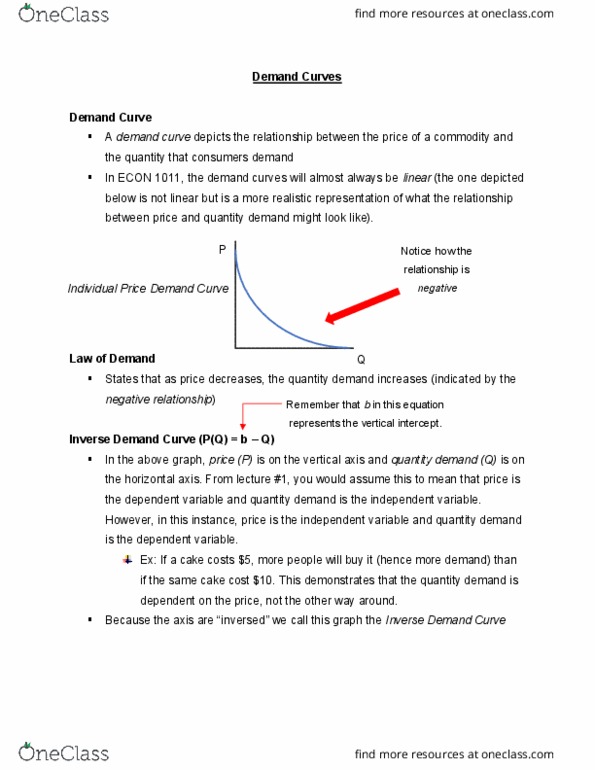
1. According to the law of demand, an increase in the price of a good causes Select one:
a. a downward movement along the demand curve for that good.
b. a rightward shift of the demand curve for that good.
c. an upward movement along the demand curve for that good.
d. a leftward shift of the demand curve for that good.
2.The relative price of a textbook is
Select one:
a. the amount it cost to make the textbook.
b. the money price of the textbook divided by the money price of some other good.
c. what the author earned for writing the textbook.
d. the price of the textbook compared with what students think it should cost.
3.Which of the following best represents the law of demand?
Select one:
a. As the price of good increases, the quantity demanded of that good decreases.
b. As the demand for a good increase, the price of that good increases.
c. As the price of a good decrease, the demand curve for that good shifts to the right.
d. As the price of a good decrease, the demand for the good increases.
4. The absolute price of a good is its
Select one:
a. subjective price.
b. money price.
c. relative price.
d. projected price.
5. The fact that when the price of a good goes up, people buy less of it is known as the
Select one:
a. law of demand.
b. concept of market equilibrium.
c. need for inferior goods.
d. law of supply.
6.The price of a commodity in terms of another commodity is
Select one:
a. the law of demand.
b. the money price.
c. a substitute.
d. the relative price.
7.Other things being equal, an increase in the price of a good leads to an increase in the amount produced. This is known as
Select one:
a. the law of supply.
b. the law of demand.
c. ceteris paribus.
d. equilibrium.
8.he direct relationship between changes in price and changes in quantity supplied is
Select one:
a. shown by a shift in the supply curve.
b. the law of relative production.
c. the law of supply.
d. a change in supply.
9. The law of supply states that other things being equal,
Select one:
a. supply creates its demand.
b. supply will increase if productivity increases.
c. supply will increase to meet demand if demand increases.
d. as price increases, quantity supplied increases.
10. a price increase will lead to an increase in quantity supplied. This statement is
Select one:
a. a normative statement.
b. untrue always.
c. the law of supply.
d. the law of demand.
11.All of the following will cause a shift in the supply of jeans EXCEPT
Select one:
a. an increase in the cost of producing jeans.
b. a per-unit government subsidy on the production of jeans.
c. a decrease in the number of jean manufacturers.
d. a decrease in the prices of jeans.
12.An increase in the price of steel to producers of refrigerators will cause
Select one:
a. the demand for refrigerators to decrease.
b. the supply curve for refrigerators to shift left.
c. the quantity demanded to feel to increase.
d. the quantity supplied of refrigerators to increase.