STAT 1430 Lecture Notes - Lecture 6: Pearson Product-Moment Correlation Coefficient, Descriptive Statistics, Regression Analysis

24 Jan 2019
School
Department
Course
Professor


STAT 1430 verified notes
6/30View all
5
STAT 1430 Lecture Notes - Lecture 5: Scatter Plot, Simple Linear Regression, Pearson Product-Moment Correlation Coefficient
6
STAT 1430 Lecture Notes - Lecture 6: Pearson Product-Moment Correlation Coefficient, Descriptive Statistics, Regression Analysis
7
STAT 1430 Lecture Notes - Lecture 7: Scatter Plot, Aspirin
Document Summary
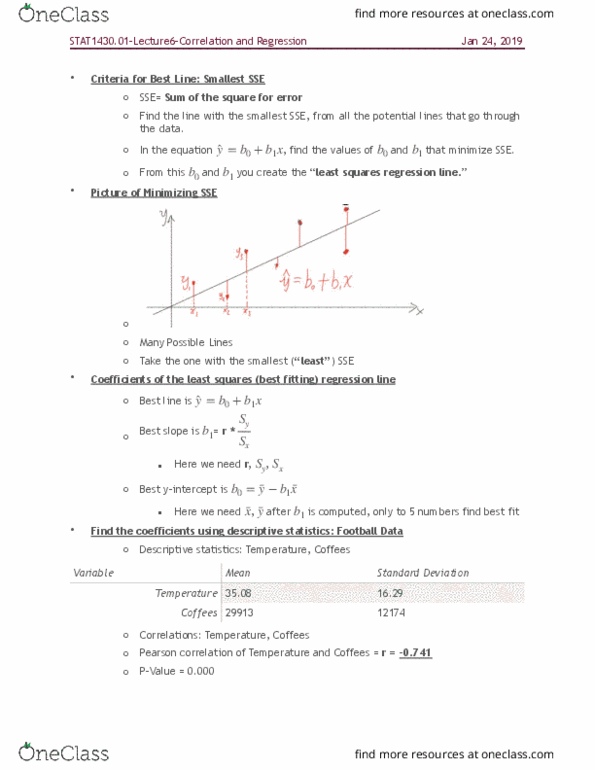
Criteria for best line: smallest sse: sse= sum of the square for error, find the line with the smallest sse, from all the potential lines that go through the data, in the equation. , find the values of b0 and b1 that minimize sse: from this b0 and b1 you create the least squares regression line. Picture of minimizing sse: many possible lines, take the one with the smallest ( least ) sse. Coefficients of the least squares (best fitting) regression line: best line is. Y = b0 + b1x: best slope is = r * b1. Sy sx: here we need r, , best y-intercept is b0 = y b1 x, here we need , after. X y b1 is computed, only to 5 numbers find best fit. Find the coefficients using descriptive statistics: football data: descriptive statistics: temperature, coffees. 12174: correlations: temperature, coffees, pearson correlation of temperature and coffees = r = -0. 741, p-value = 0. 000.